Monitor your Raspberry Pi using Grafana Cloud
Monitor your Raspberry Pi using Grafana Cloud
Original post from linux.xvx.cz
Recently my SD card in Raspberry Pi died, because I was storing there the Prometheus data used for monitoring. Frequent writes to the SD card probably destroyed it. Anyway I was looking for an alternative to monitor the RPi without running it (Grafana, Prometheus) myself.
The Grafana Labs offers Grafana Cloud in free version which is powerful enough to get the monitoring data from your RPi including logs.
Here are the steps to configure your Raspberry Pi to use Grafana Cloud:
Grafana Cloud Setup
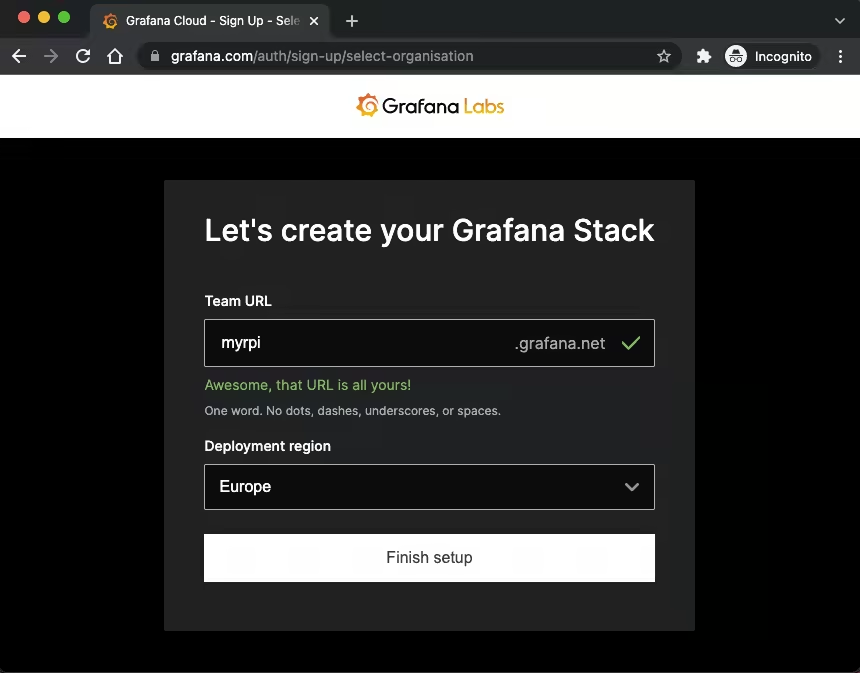
- Go to Grafana Cloud and create a new account.
Select your “Team URL” and region:
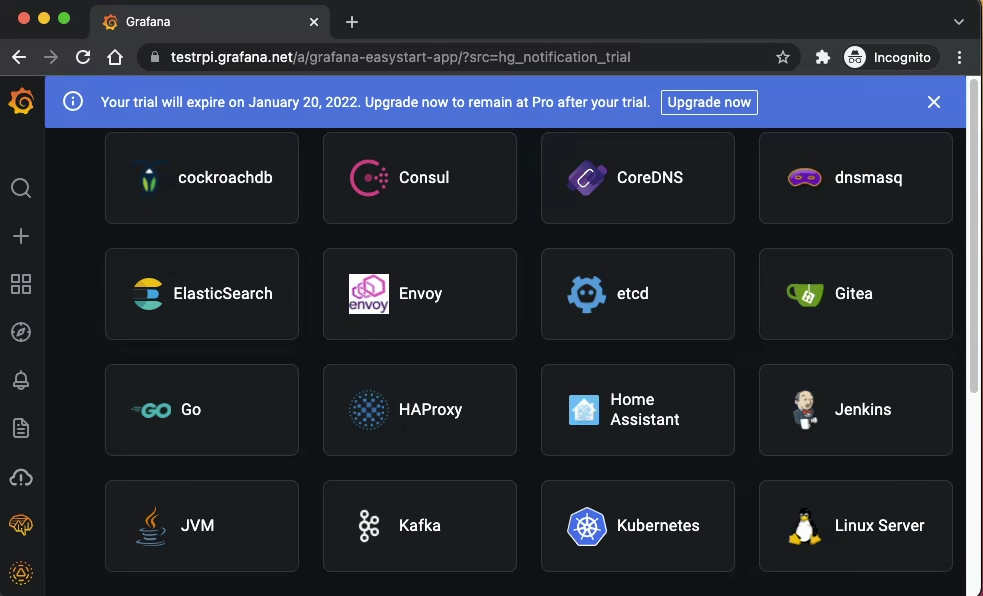
Then select the “Linux Server” and click “Install integration”
- I left the “Debian - based” as a default and changed the “Architecture” to “Armv7”
Copy the content from the Grafana Agent field and paste it to your shell connected to RPi
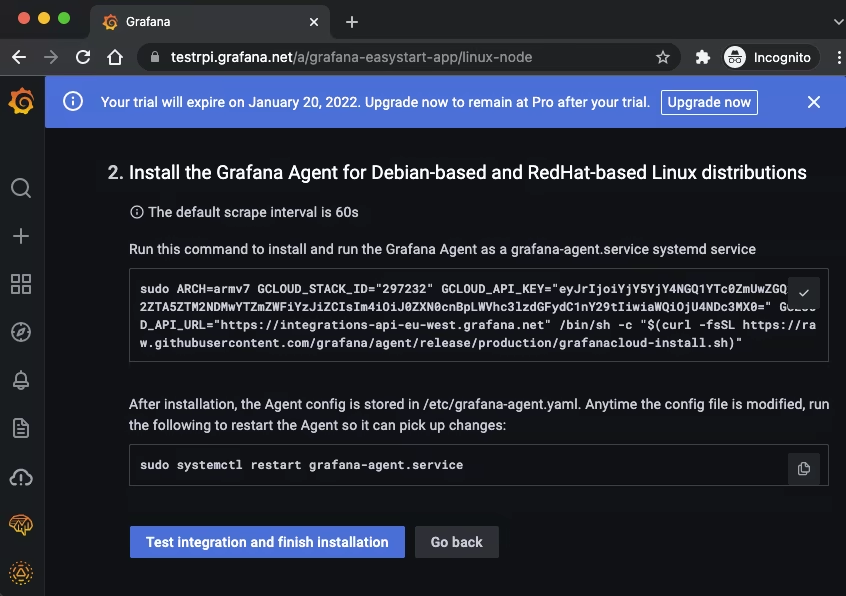
Then continue by “Test integration and finish installation”:

After these steps the Grafana Agent should be configured and should start sending data to Grafana Cloud.
Raspberry Pi
It will be handy to add a few more features and configure Grafana Agent a little bit…
Do the changes in the terminal:
1
2
3
4
5
6
7
8
9
10
11
12
13
14
15
16
17
18
19
20
21
22
23
24
25
26
27
28
29
30
31
32
33
34
35
36
37
38
39
40
41
42
43
44
45
46
47
48
49
50
51
52
53
54
55
56
57
58
59
60
61
62
63
64
65
66
67
68
69
70
71
72
73
74
75
76
77
78
79
80
81
82
83
84
85
86
87
88
89
90
91
92
93
94
95
96
97
98
99
100
101
102
103
104
105
106
107
108
109
110
111
112
113
114
115
116
117
118
119
# Install blackbox-exporter
apt update
apt install -y prometheus-blackbox-exporter

# Change the grafana agent config file /etc/grafana-agent.yaml
cat > /etc/grafana-agent.yaml << EOF
integrations:
  agent:
    enabled: true
  process_exporter:
    enabled: true
    process_names:
      - comm:
        - grafana-agent
        - prometheus-blac
        - systemd
  node_exporter:
    enabled: true
    enable_collectors:
      - interrupts
      - meminfo_numa
      - mountstats
      - systemd
      - tcpstat
  prometheus_remote_write:
  - basic_auth:
      password: eyxxxxxxxxxxxxxxxF9
      username: 2xxxxxx2
    url: https://prometheus-prod-01-eu-west-0.grafana.net/api/prom/push
loki:
  configs:
  - clients:
    - basic_auth:
        password: eyxxxxxxxxxxxxxxxF9
        username: 1yyyyyyyy6
      url: https://logs-prod-eu-west-0.grafana.net/api/prom/push
    name: integrations
    positions:
      filename: /tmp/positions.yaml
    target_config:
      sync_period: 10s
    scrape_configs:
      - job_name: system
        static_configs:
        - labels:
            __path__: /var/log/{*log,daemon,messages}
            job: varlogs
          targets:
          - localhost
prometheus:
  configs:
    - name: agent
      scrape_configs:
        - job_name: grafana-agent
          static_configs:
            - targets: ['127.0.0.1:12345']
        - job_name: blackbox-http_2xx
          metrics_path: /probe
          params:
            module: [http_2xx]
          static_configs:
            - targets:
              - http://192.168.1.1
              - https://google.com
              - https://root.cz
          relabel_configs:
            - source_labels: [__address__]
              target_label: __param_target
            - source_labels: [__param_target]
              target_label: instance
            - target_label: __address__
              replacement: 127.0.0.1:9115
        - job_name: blackbox-icmp
          metrics_path: /probe
          params:
            module: [icmp]
          scrape_interval: 5s
          static_configs:
            - targets:
              - 192.168.1.1
              - google.com
              - root.cz
          relabel_configs:
            - source_labels: [__address__]
              target_label: __param_target
            - source_labels: [__param_target]
              target_label: instance
            - target_label: __address__
              replacement: 127.0.0.1:9115
      remote_write:
      - basic_auth:
          password: eyxxxxxxxxxxxxxxxF9
          username: 2xxxxxx2
        url: https://prometheus-prod-01-eu-west-0.grafana.net/api/prom/push
  global:
    scrape_interval: 60s
  wal_directory: /tmp/grafana-agent-wal
server:
  http_listen_port: 12345
EOF

# Change the grafana agent config file /etc/prometheus/blackbox.yml and add preferred protocol
cat > /etc/prometheus/blackbox.yml << EOF
modules:
  http_2xx:
    prober: http
    http:
      preferred_ip_protocol: ip4
  tcp_connect:
    prober: tcp
    tcp:
      preferred_ip_protocol: ip4
  icmp:
    prober: icmp
    icmp:
      preferred_ip_protocol: ip4
EOF

systemctl restart prometheus-blackbox-exporter grafana-agent
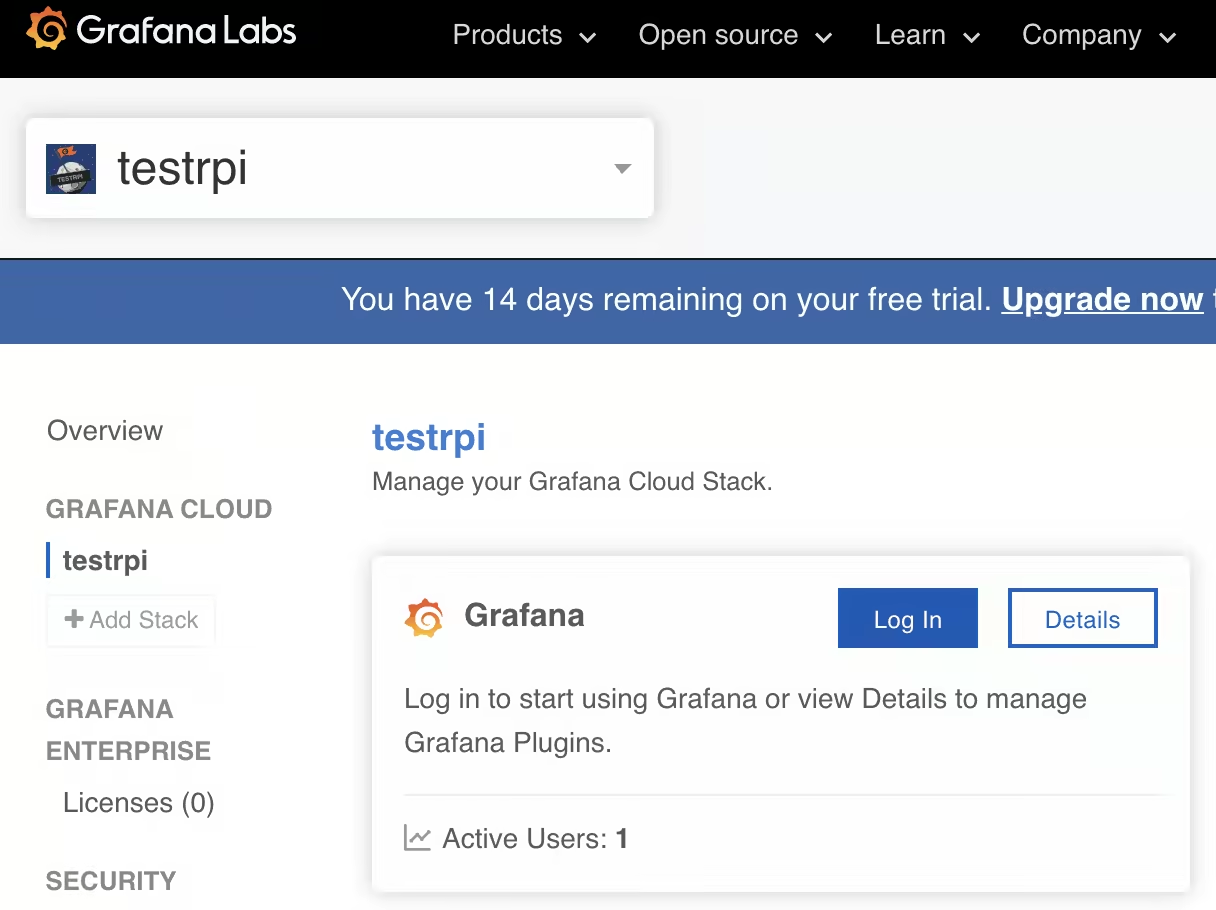
Then go to the Grafana Cloud again…
Grafana Cloud Dashboards
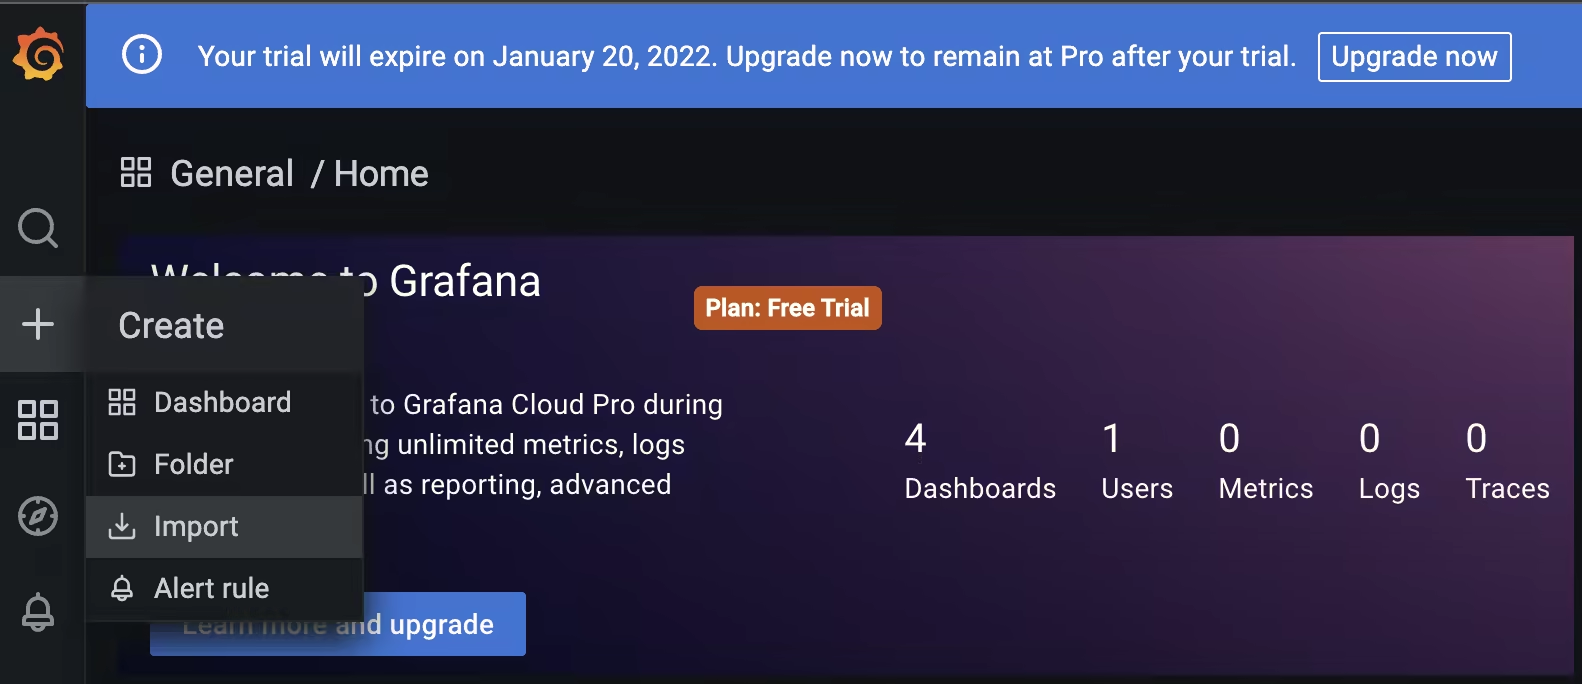
Login to Grafana Cloud again and click on Grafana:
Click on Import:
Import these Dashboards with numbers
- 13659 - Blackbox Exporter (HTTP prober)
- 9719 - Decentralized Blackbox Exporter
- 12412 - ICMP exporter
- 7587 - Prometheus Blackbox Exporter
- 4202 - Named processes by host
- 715 - Named processes stacked
- 8378 - System Processes Metrics
- 5984 - Alerts - Linux Nodes
- 1860 - Node Exporter Full
- 405 - Node Exporter Server Metrics
Do not forget to select the proper prometheus datasource (ends with
-prom):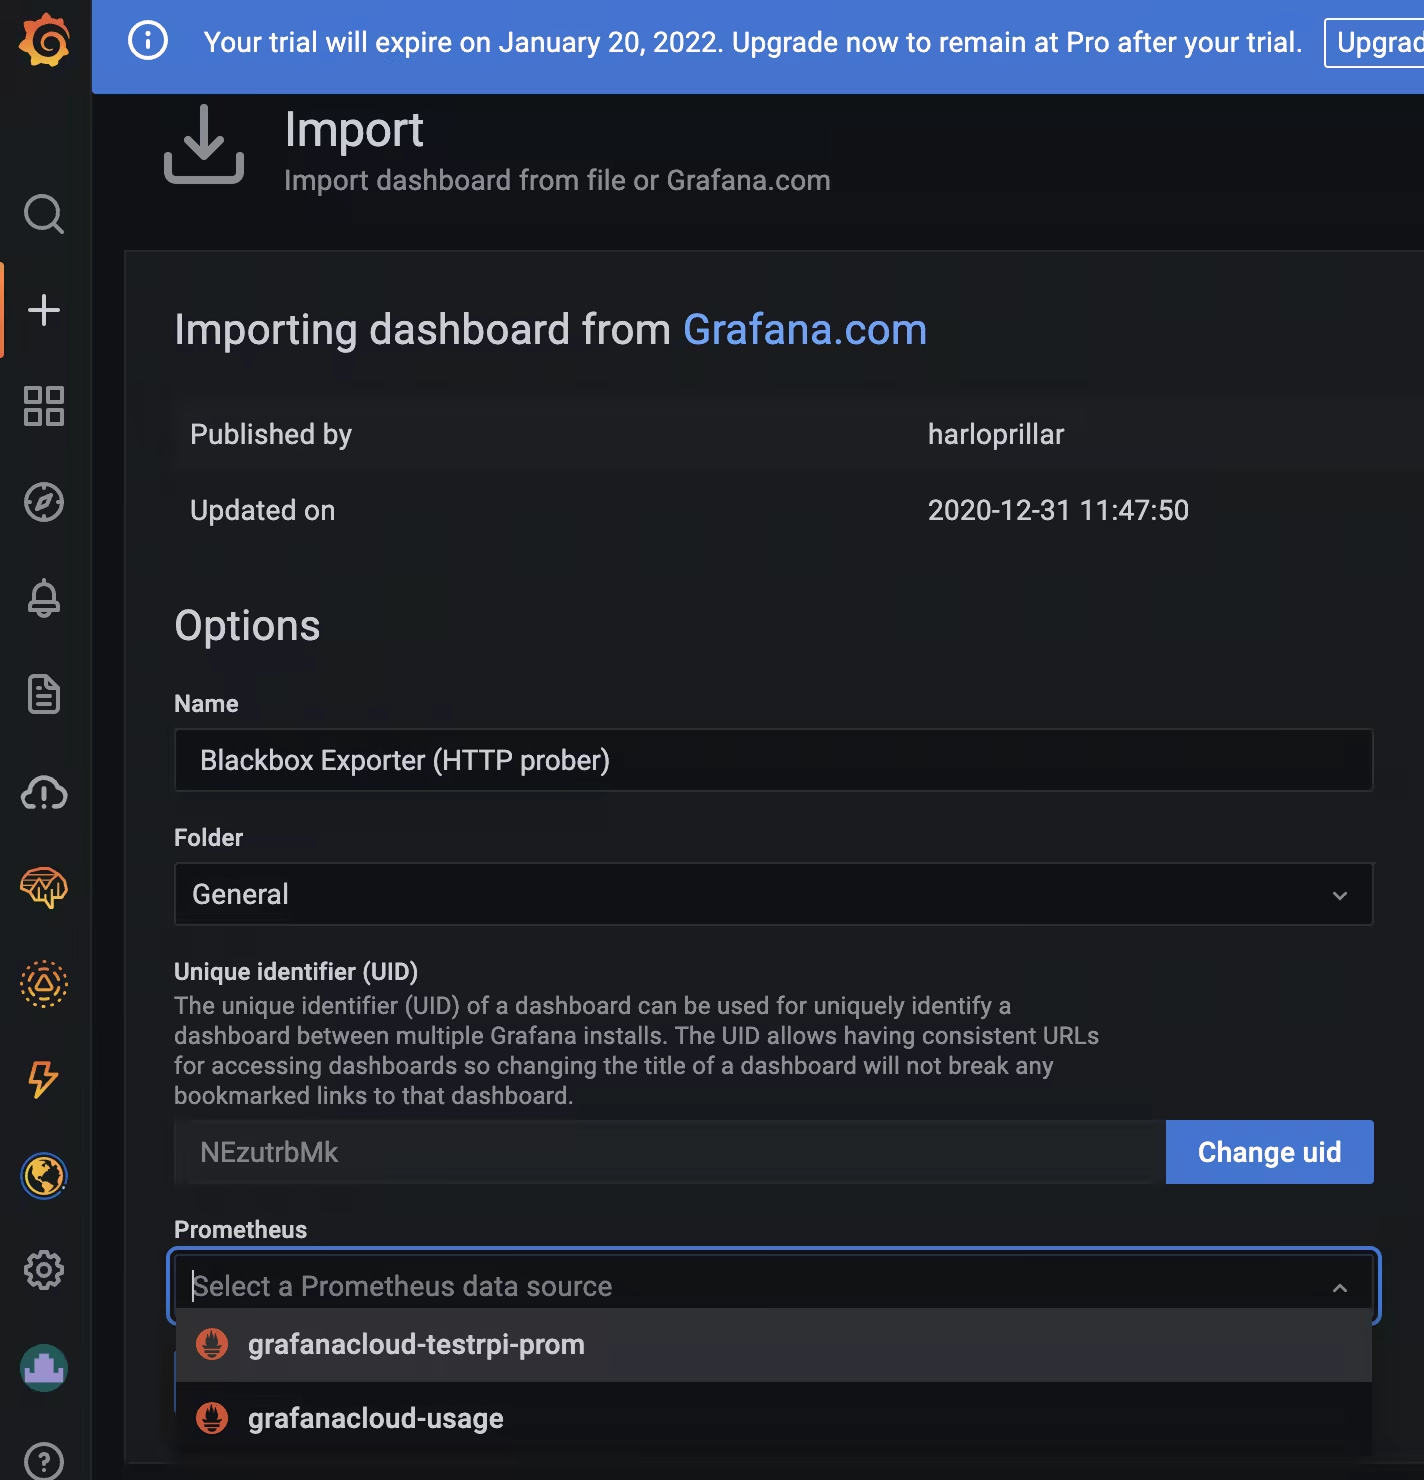
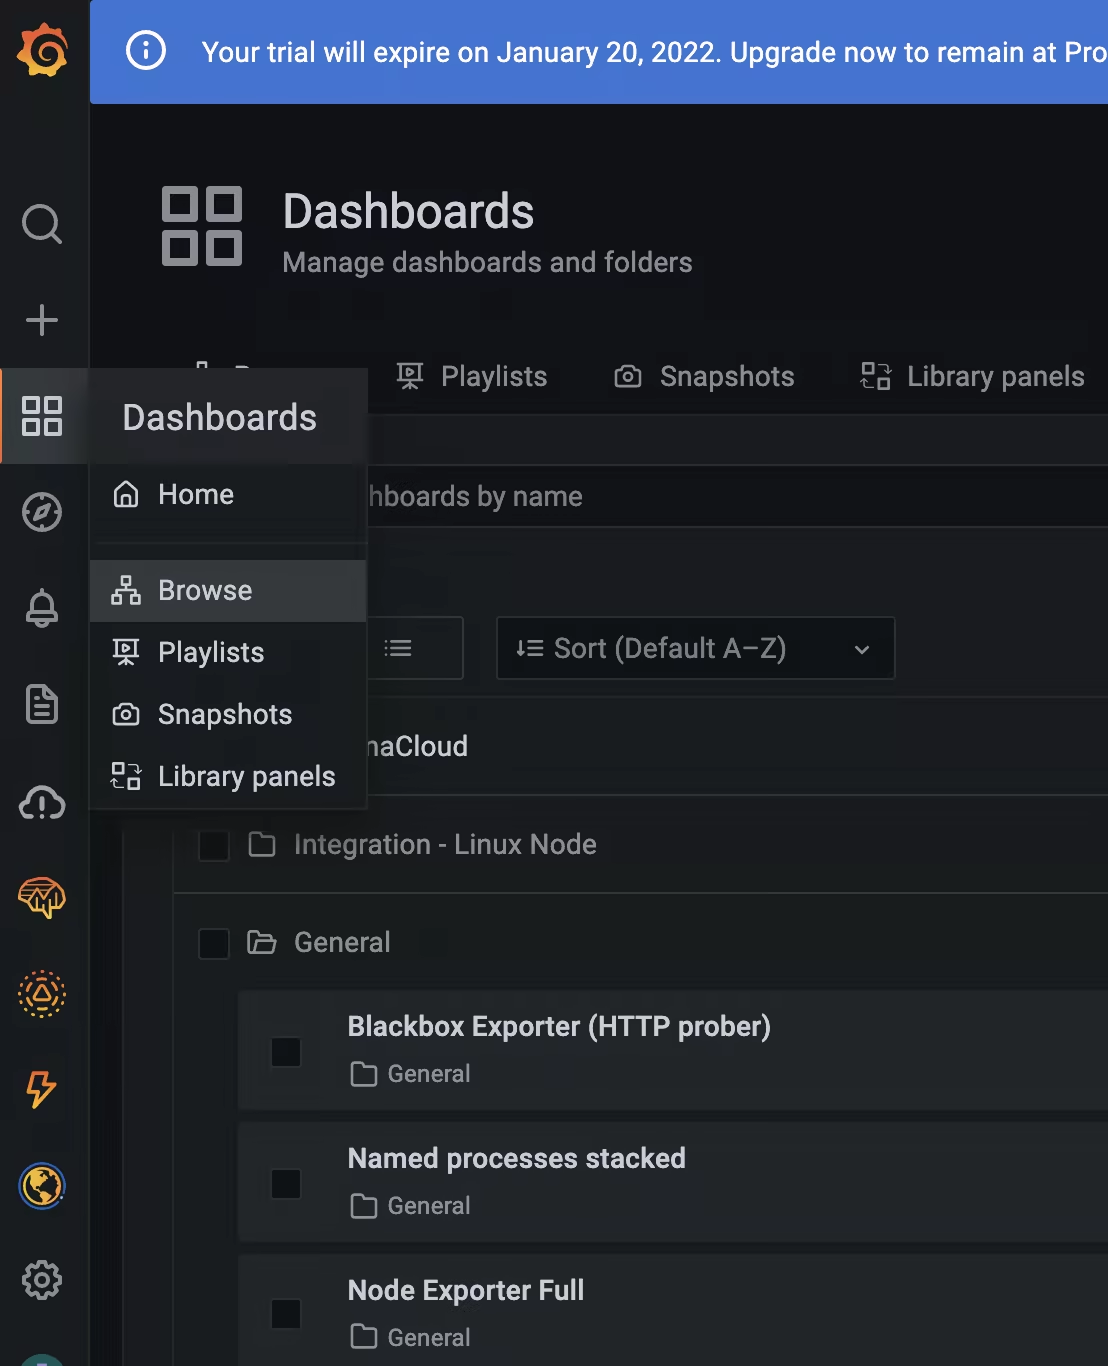
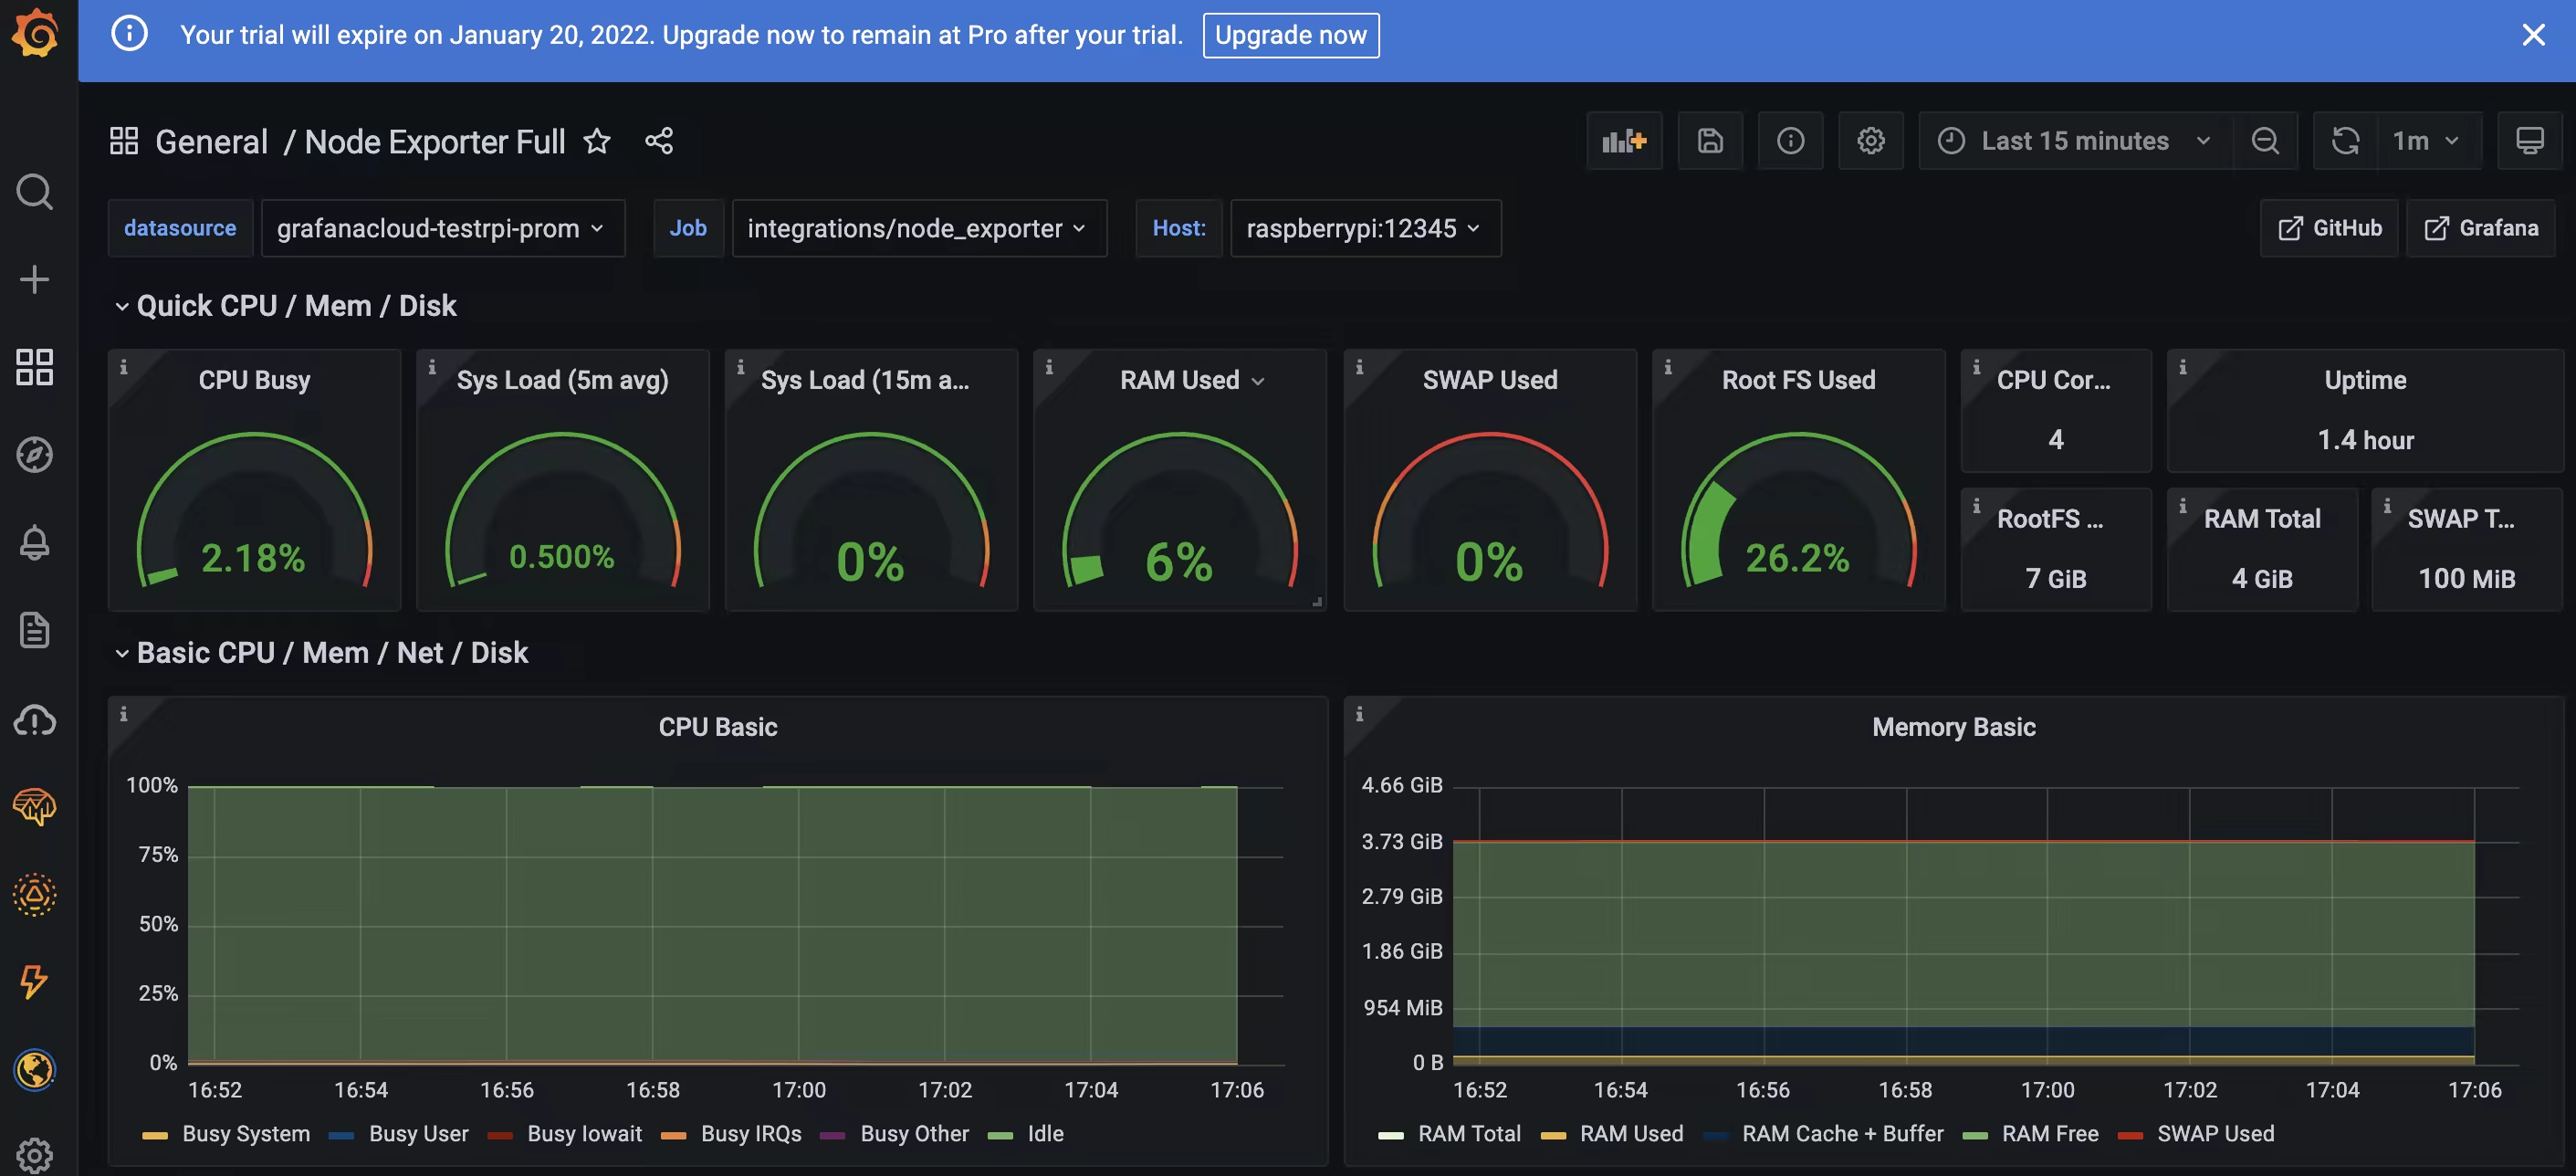
After you import the Dashboard you should see them by going to “Dashboards -> Browse”:
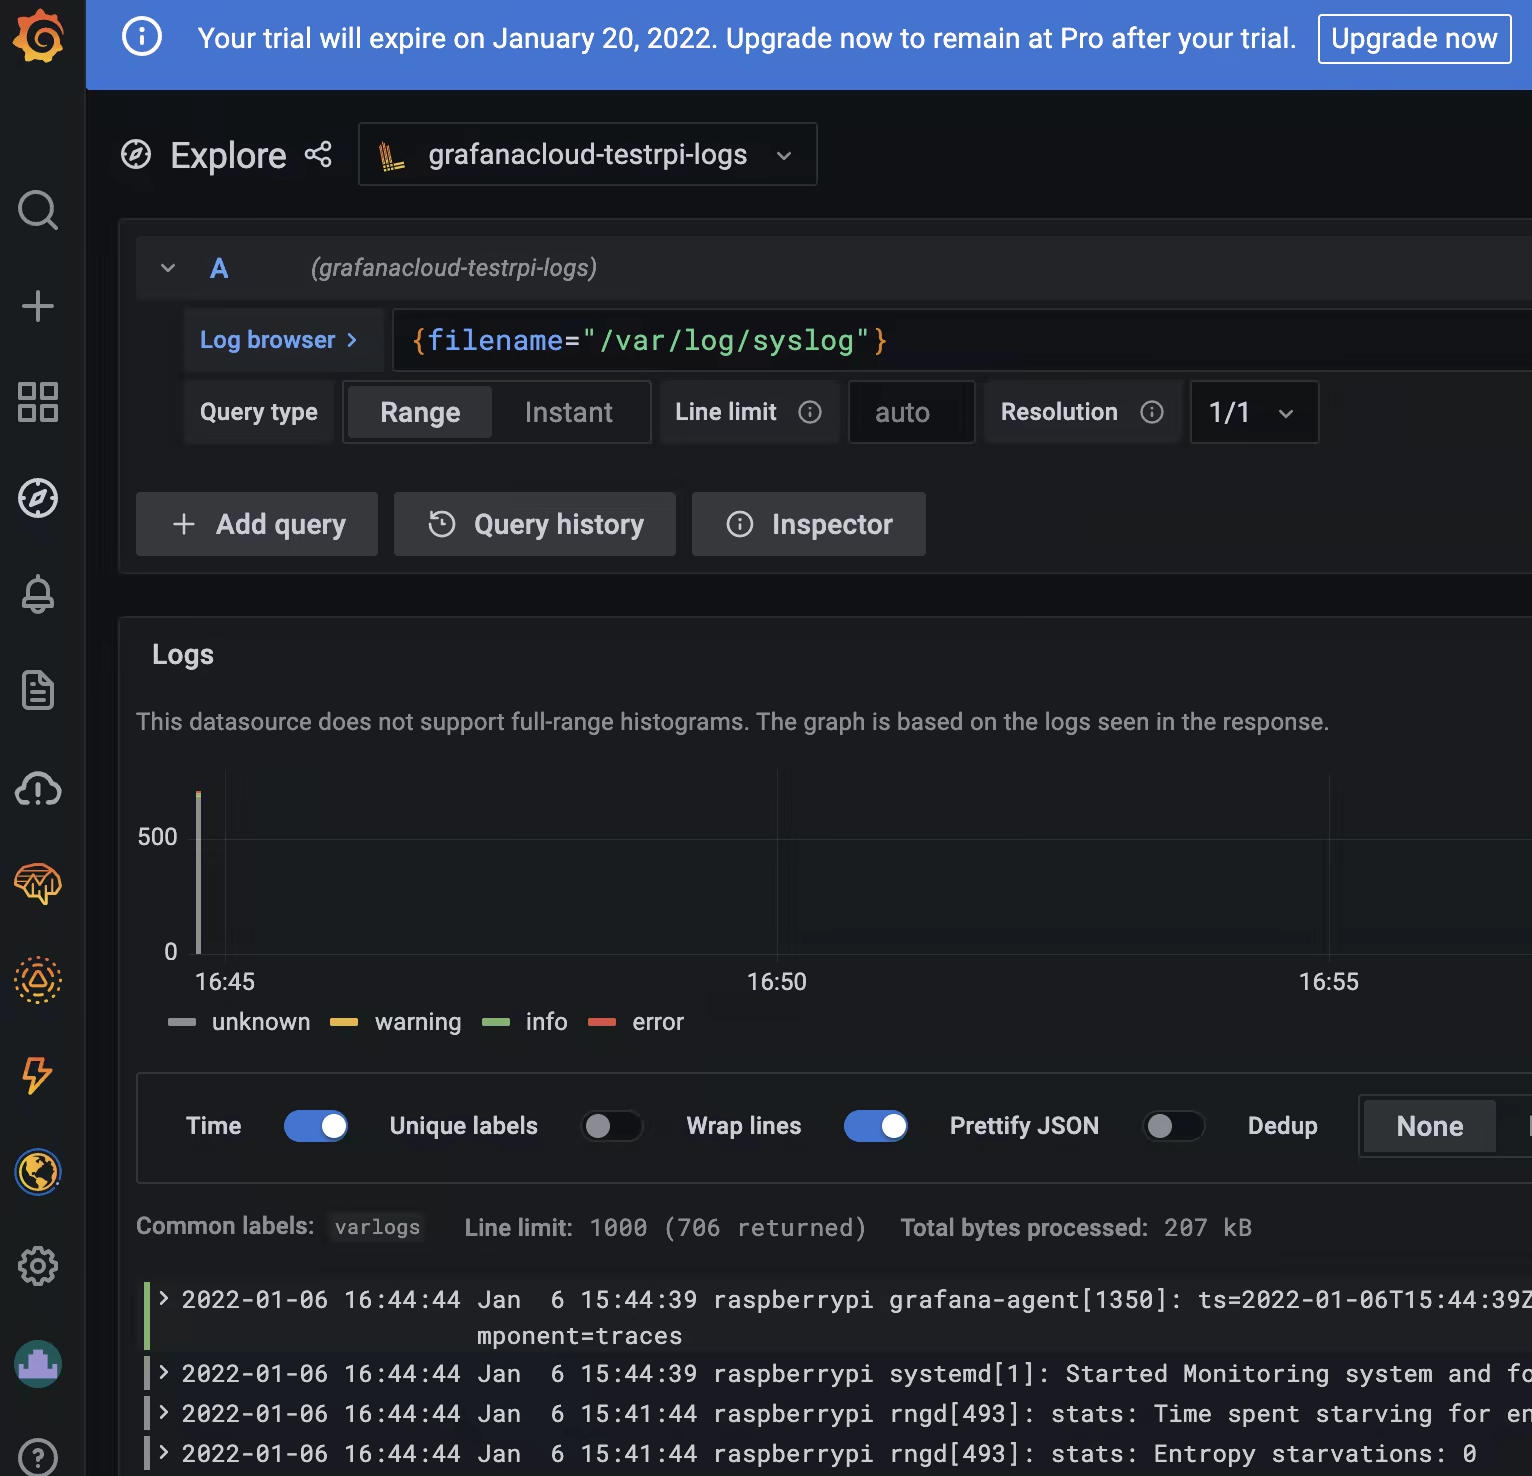
You can also see the logs from your RPi collected by Loki:
The YouTube video showing all the steps can be found here:
Enjoy 😉