Amazon EKS and Grafana stack
Build secure Amazon EKS cluster with Grafana stack
I will outline the steps for setting up an Amazon EKS environment that prioritizes security, including the configuration of standard applications.
The Amazon EKS setup should align with the following criteria:
- Utilize two Availability Zones (AZs), or a single zone if possible, to reduce payments for cross-AZ traffic
- Spot instances
- Less expensive region -
us-east-1 - Most price efficient EC2 instance type
t4g.medium(2 x CPU, 4GB RAM) using AWS Graviton based on ARM - Use Bottlerocket OS for a minimal operating system, CPU, and memory footprint
- Leverage Network Load Balancer (NLB) for highly cost-effective and optimized load balancing
- Karpenter to enable automatic node scaling that matches the specific resource requirements of pods
- The Amazon EKS control plane must be encrypted using KMS
- Worker node EBS volumes must be encrypted
- EKS cluster logging to CloudWatch must be configured
- Network Policies should be enabled where supported
- EKS Pod Identities should be used to allow applications and pods to communicate with AWS APIs
Build Amazon EKS
Requirements
You will need to configure the AWS CLI and set up other necessary secrets and variables:
1
2
3
4
5
6
7
# AWS Credentials
export AWS_ACCESS_KEY_ID="xxxxxxxxxxxxxxxxxx"
export AWS_SECRET_ACCESS_KEY="xxxxxxxxxxxxxxxxxxxxxxxxxxxxxxxxxxxxxx"
export AWS_SESSION_TOKEN="xxxxxxxx"
export AWS_ROLE_TO_ASSUME="arn:aws:iam::7xxxxxxxxxx7:role/Gixxxxxxxxxxxxxxxxxxxxle"
export GOOGLE_CLIENT_ID="10xxxxxxxxxxxxxxxud.apps.googleusercontent.com"
export GOOGLE_CLIENT_SECRET="GOxxxxxxxxxxxxxxxtw"
If you plan to follow this document and its tasks, you will need to set up a few environment variables, such as:
1
2
3
4
5
6
7
8
9
10
11
12
13
14
15
16
# AWS Region
export AWS_REGION="${AWS_REGION:-us-east-1}"
# Hostname / FQDN definitions
export CLUSTER_FQDN="${CLUSTER_FQDN:-k01.k8s.mylabs.dev}"
# Base Domain: k8s.mylabs.dev
export BASE_DOMAIN="${CLUSTER_FQDN#*.}"
# Cluster Name: k01
export CLUSTER_NAME="${CLUSTER_FQDN%%.*}"
export MY_EMAIL="petr.ruzicka@gmail.com"
export TMP_DIR="${TMP_DIR:-${PWD}/tmp}"
export KUBECONFIG="${KUBECONFIG:-${TMP_DIR}/${CLUSTER_FQDN}/kubeconfig-${CLUSTER_NAME}.conf}"
# Tags used to tag the AWS resources
export TAGS="${TAGS:-Owner=${MY_EMAIL},Environment=dev,Cluster=${CLUSTER_FQDN}}"
export AWS_PARTITION="aws"
AWS_ACCOUNT_ID=$(aws sts get-caller-identity --query "Account" --output text) && export AWS_ACCOUNT_ID
mkdir -pv "${TMP_DIR}/${CLUSTER_FQDN}"
Confirm that all essential variables have been properly configured:
1
2
3
4
5
6
7
8
: "${AWS_ACCESS_KEY_ID?}"
: "${AWS_REGION?}"
: "${AWS_SECRET_ACCESS_KEY?}"
: "${AWS_ROLE_TO_ASSUME?}"
: "${GOOGLE_CLIENT_ID?}"
: "${GOOGLE_CLIENT_SECRET?}"

echo -e "${MY_EMAIL} | ${CLUSTER_NAME} | ${BASE_DOMAIN} | ${CLUSTER_FQDN}\n${TAGS}"
Install the required tools:
You can bypass these procedures if you already have all the essential software installed.
Configure AWS Route 53 Domain delegation
The DNS delegation tasks should be executed as a one-time operation.
Create a DNS zone for the EKS clusters:
1
2
3
4
5
6
7
export CLOUDFLARE_EMAIL="petr.ruzicka@gmail.com"
export CLOUDFLARE_API_KEY="1xxxxxxxxx0"

aws route53 create-hosted-zone --output json \
  --name "${BASE_DOMAIN}" \
  --caller-reference "$(date)" \
  --hosted-zone-config="{\"Comment\": \"Created by petr.ruzicka@gmail.com\", \"PrivateZone\": false}" | jq
 Route53 k8s.mylabs.dev zone
Utilize your domain registrar to update the nameservers for your zone (e.g., mylabs.dev) to point to Amazon Route 53 nameservers. Here’s how to discover the required Route 53 nameservers:
1
2
3
4
NEW_ZONE_ID=$(aws route53 list-hosted-zones --query "HostedZones[?Name==\`${BASE_DOMAIN}.\`].Id" --output text)
NEW_ZONE_NS=$(aws route53 get-hosted-zone --output json --id "${NEW_ZONE_ID}" --query "DelegationSet.NameServers")
NEW_ZONE_NS1=$(echo "${NEW_ZONE_NS}" | jq -r ".[0]")
NEW_ZONE_NS2=$(echo "${NEW_ZONE_NS}" | jq -r ".[1]")
Establish the NS record in k8s.mylabs.dev (your BASE_DOMAIN) for proper zone delegation. This operation’s specifics may vary based on your domain registrar; I use Cloudflare and employ Ansible for automation:
1
2
ansible -m cloudflare_dns -c local -i "localhost," localhost -a "zone=mylabs.dev record=${BASE_DOMAIN} type=NS value=${NEW_ZONE_NS1} solo=true proxied=no account_email=${CLOUDFLARE_EMAIL} account_api_token=${CLOUDFLARE_API_KEY}"
ansible -m cloudflare_dns -c local -i "localhost," localhost -a "zone=mylabs.dev record=${BASE_DOMAIN} type=NS value=${NEW_ZONE_NS2} solo=false proxied=no account_email=${CLOUDFLARE_EMAIL} account_api_token=${CLOUDFLARE_API_KEY}"
1
2
3
4
5
6
7
8
9
10
11
12
13
14
15
16
17
18
19
20
21
22
23
24
25
26
27
28
29
30
31
32
33
34
35
36
37
38
39
40
41
42
43
44
45
46
47
48
49
50
51
52
53
54
55
56
localhost | CHANGED => {
    "ansible_facts": {
        "discovered_interpreter_python": "/usr/bin/python"
    },
    "changed": true,
    "result": {
        "record": {
            "content": "ns-885.awsdns-46.net",
            "created_on": "2020-11-13T06:25:32.18642Z",
            "id": "dxxxxxxxxxxxxxxxxxxxxxxxxxxxxxxb",
            "locked": false,
            "meta": {
                "auto_added": false,
                "managed_by_apps": false,
                "managed_by_argo_tunnel": false,
                "source": "primary"
            },
            "modified_on": "2020-11-13T06:25:32.18642Z",
            "name": "k8s.mylabs.dev",
            "proxiable": false,
            "proxied": false,
            "ttl": 1,
            "type": "NS",
            "zone_id": "2xxxxxxxxxxxxxxxxxxxxxxxxxxxxxxe",
            "zone_name": "mylabs.dev"
        }
    }
}
localhost | CHANGED => {
    "ansible_facts": {
        "discovered_interpreter_python": "/usr/bin/python"
    },
    "changed": true,
    "result": {
        "record": {
            "content": "ns-1692.awsdns-19.co.uk",
            "created_on": "2020-11-13T06:25:37.605605Z",
            "id": "9xxxxxxxxxxxxxxxxxxxxxxxxxxxxxxb",
            "locked": false,
            "meta": {
                "auto_added": false,
                "managed_by_apps": false,
                "managed_by_argo_tunnel": false,
                "source": "primary"
            },
            "modified_on": "2020-11-13T06:25:37.605605Z",
            "name": "k8s.mylabs.dev",
            "proxiable": false,
            "proxied": false,
            "ttl": 1,
            "type": "NS",
            "zone_id": "2xxxxxxxxxxxxxxxxxxxxxxxxxxxxxxe",
            "zone_name": "mylabs.dev"
        }
    }
}
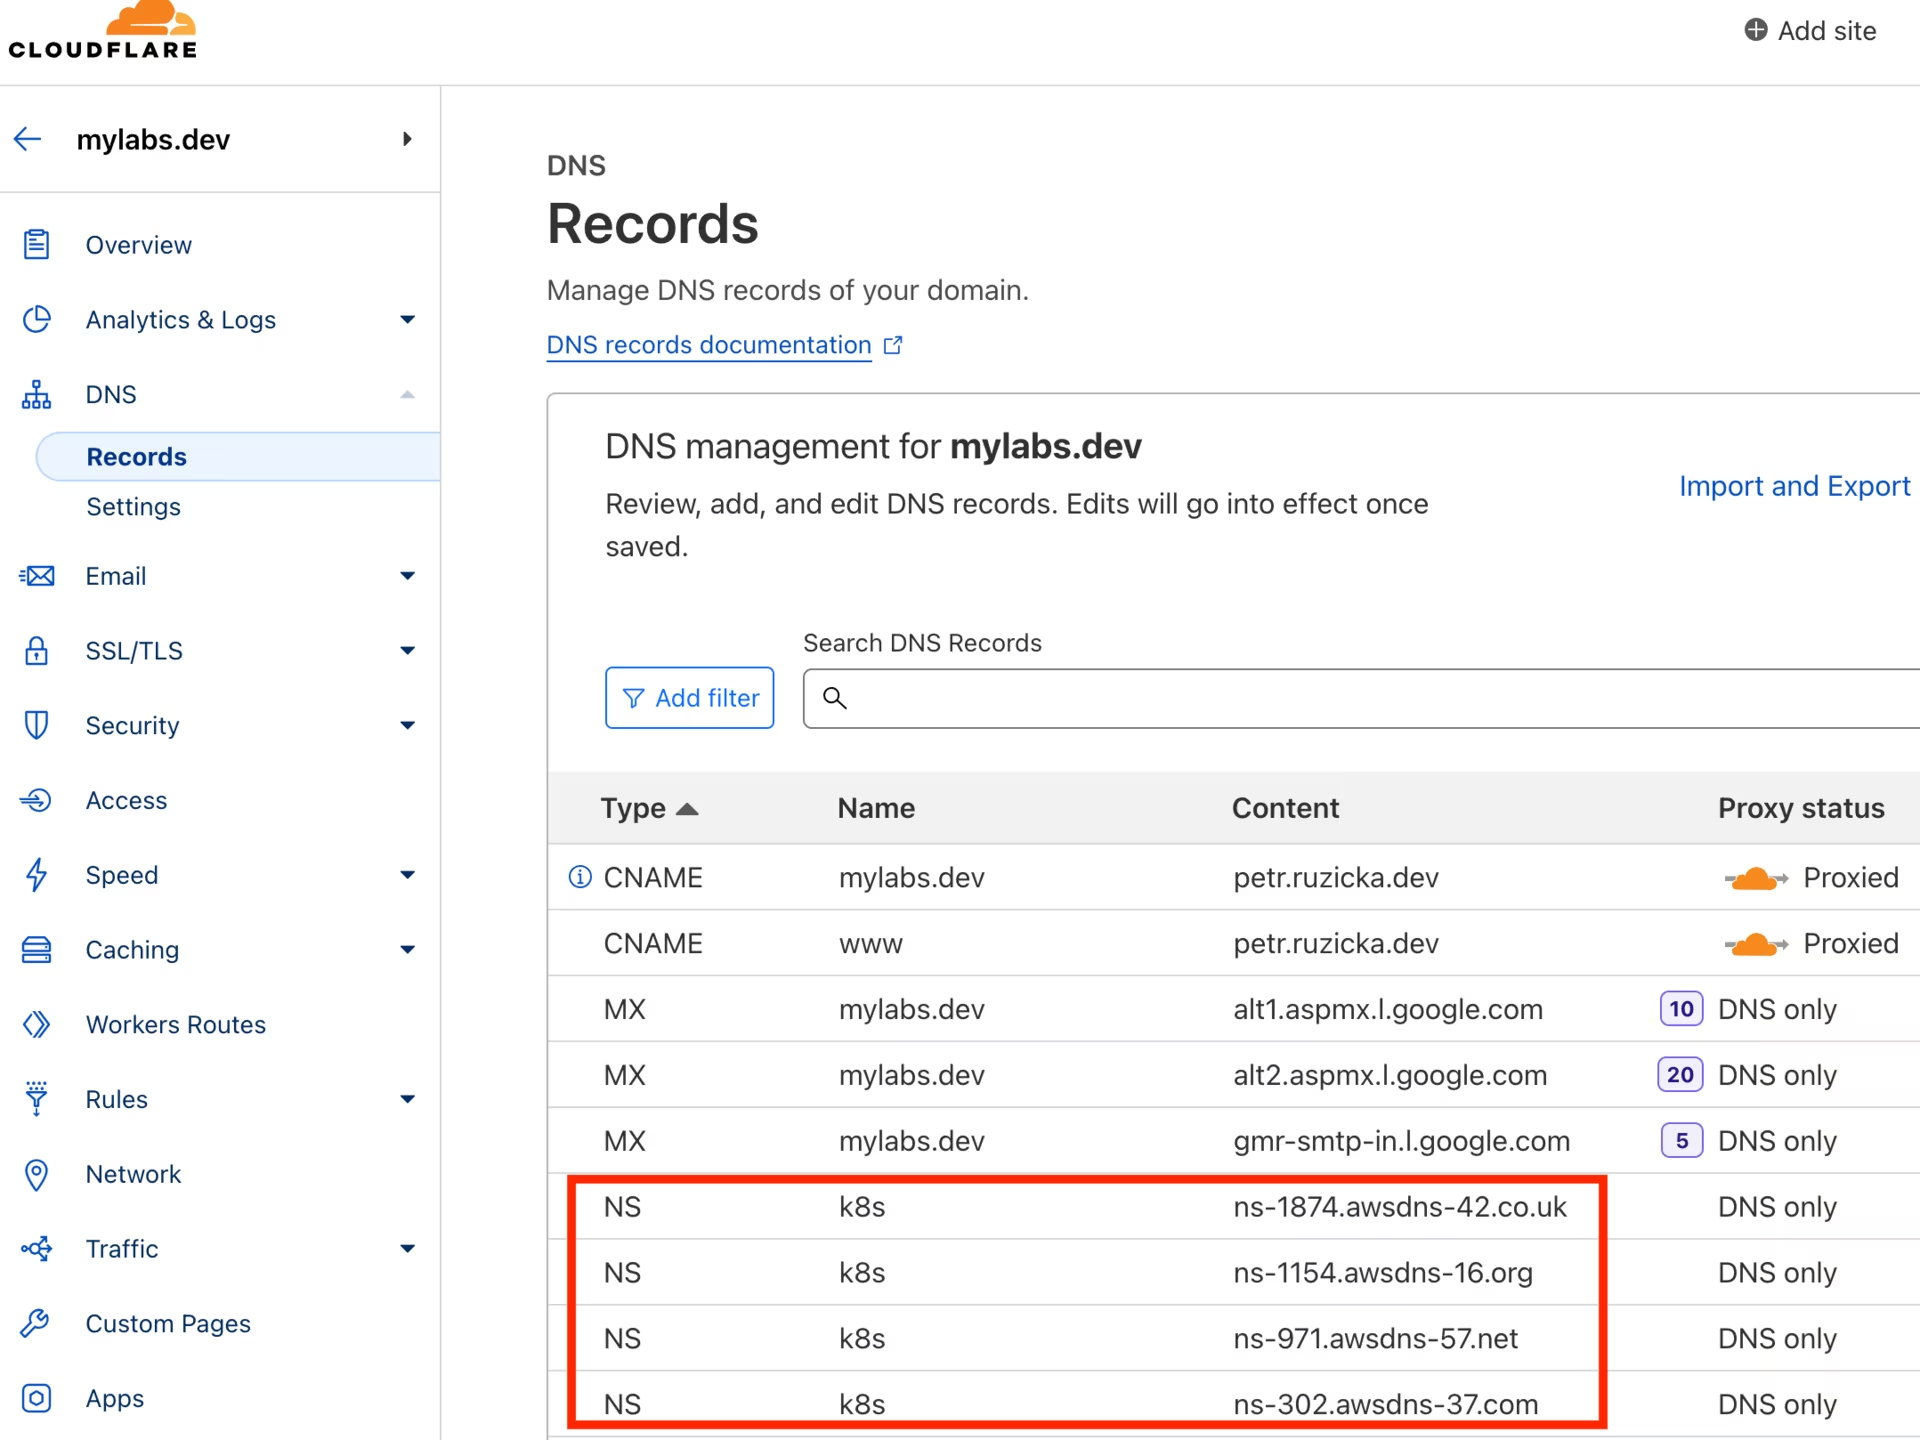 CloudFlare mylabs.dev zone
Create the service-linked role
Creating the service-linked role for Spot Instances is a one-time operation.
Create the AWSServiceRoleForEC2Spot role to use Spot Instances in the Amazon EKS cluster:
1
aws iam create-service-linked-role --aws-service-name spot.amazonaws.com
Details: Work with Spot Instances
Create Route53 zone and KMS key infrastructure
Generate a CloudFormation template that defines an Amazon Route 53 zone and an AWS Key Management Service (KMS) key.
Add the new domain CLUSTER_FQDN to Route 53, and set up DNS delegation from the BASE_DOMAIN.
1
2
3
4
5
6
7
8
9
10
11
12
13
14
15
16
17
18
19
20
21
22
23
24
25
26
27
28
29
30
31
32
33
34
35
36
37
38
39
40
41
42
43
44
45
46
47
48
49
50
51
52
53
54
55
56
57
58
59
60
61
62
63
64
65
66
67
68
69
70
71
72
73
74
75
76
77
78
79
80
81
82
83
84
85
86
87
88
89
90
91
92
93
94
95
96
97
98
99
100
101
102
103
104
105
106
107
108
109
110
111
112
113
114
115
116
117
tee "${TMP_DIR}/${CLUSTER_FQDN}/aws-cf-route53-kms.yml" << \EOF
AWSTemplateFormatVersion: 2010-09-09
Description: Route53 entries and KMS key

Parameters:
  BaseDomain:
    Description: "Base domain where cluster domains + their subdomains will live - Ex: k8s.mylabs.dev"
    Type: String
  ClusterFQDN:
    Description: "Cluster FQDN (domain for all applications) - Ex: k01.k8s.mylabs.dev"
    Type: String
  ClusterName:
    Description: "Cluster Name - Ex: k01"
    Type: String
Resources:
  HostedZone:
    Type: AWS::Route53::HostedZone
    Properties:
      Name: !Ref ClusterFQDN
  RecordSet:
    Type: AWS::Route53::RecordSet
    Properties:
      HostedZoneName: !Sub "${BaseDomain}."
      Name: !Ref ClusterFQDN
      Type: NS
      TTL: 60
      ResourceRecords: !GetAtt HostedZone.NameServers
  KMSAlias:
    Type: AWS::KMS::Alias
    Properties:
      AliasName: !Sub "alias/eks-${ClusterName}"
      TargetKeyId: !Ref KMSKey
  KMSKey:
    Type: AWS::KMS::Key
    Properties:
      Description: !Sub "KMS key for ${ClusterName} Amazon EKS"
      EnableKeyRotation: true
      PendingWindowInDays: 7
      KeyPolicy:
        Version: "2012-10-17"
        Id: !Sub "eks-key-policy-${ClusterName}"
        Statement:
          - Sid: Allow direct access to key metadata to the account
            Effect: Allow
            Principal:
              AWS:
                - !Sub "arn:${AWS::Partition}:iam::${AWS::AccountId}:root"
            Action:
              - kms:*
            Resource: "*"
          - Sid: Allow access through EBS for all principals in the account that are authorized to use EBS
            Effect: Allow
            Principal:
              AWS: "*"
            Action:
              - kms:Encrypt
              - kms:Decrypt
              - kms:ReEncrypt*
              - kms:GenerateDataKey*
              - kms:CreateGrant
              - kms:DescribeKey
            Resource: "*"
            Condition:
              StringEquals:
                kms:ViaService: !Sub "ec2.${AWS::Region}.amazonaws.com"
                kms:CallerAccount: !Sub "${AWS::AccountId}"
  S3AccessPolicy:
    Type: AWS::IAM::ManagedPolicy
    Properties:
      ManagedPolicyName: !Sub "eksctl-${ClusterName}-s3-access-policy"
      PolicyDocument:
        Version: '2012-10-17'
        Statement:
          - Effect: Allow
            Action:
              - s3:AbortMultipartUpload
              - s3:DeleteObject
              - s3:GetObject
              - s3:ListMultipartUploadParts
              - s3:ListObjects
              - s3:PutObject
              - s3:PutObjectTagging
            Resource: !Sub "arn:aws:s3:::${ClusterFQDN}/*"
          - Effect: Allow
            Action:
              - s3:ListBucket
            Resource: !Sub "arn:aws:s3:::${ClusterFQDN}"
Outputs:
  KMSKeyArn:
    Description: The ARN of the created KMS Key to encrypt EKS related services
    Value: !GetAtt KMSKey.Arn
    Export:
      Name:
        Fn::Sub: "${AWS::StackName}-KMSKeyArn"
  KMSKeyId:
    Description: The ID of the created KMS Key to encrypt EKS related services
    Value: !Ref KMSKey
    Export:
      Name:
        Fn::Sub: "${AWS::StackName}-KMSKeyId"
  S3AccessPolicyArn:
    Description: IAM policy ARN for S3 access by EKS workloads
    Value: !Ref S3AccessPolicy
    Export:
      Name:
        Fn::Sub: "${AWS::StackName}-S3AccessPolicy"
EOF

# shellcheck disable=SC2001
eval aws cloudformation deploy --capabilities CAPABILITY_NAMED_IAM \
  --parameter-overrides "BaseDomain=${BASE_DOMAIN} ClusterFQDN=${CLUSTER_FQDN} ClusterName=${CLUSTER_NAME}" \
  --stack-name "${CLUSTER_NAME}-route53-kms" --template-file "${TMP_DIR}/${CLUSTER_FQDN}/aws-cf-route53-kms.yml" --tags "${TAGS//,/ }"

AWS_CLOUDFORMATION_DETAILS=$(aws cloudformation describe-stacks --stack-name "${CLUSTER_NAME}-route53-kms" --query "Stacks[0].Outputs[? OutputKey==\`KMSKeyArn\` || OutputKey==\`KMSKeyId\` || OutputKey==\`S3AccessPolicyArn\`].{OutputKey:OutputKey,OutputValue:OutputValue}")
AWS_KMS_KEY_ARN=$(echo "${AWS_CLOUDFORMATION_DETAILS}" | jq -r ".[] | select(.OutputKey==\"KMSKeyArn\") .OutputValue")
AWS_KMS_KEY_ID=$(echo "${AWS_CLOUDFORMATION_DETAILS}" | jq -r ".[] | select(.OutputKey==\"KMSKeyId\") .OutputValue")
AWS_S3_ACCESS_POLICY_ARN=$(echo "${AWS_CLOUDFORMATION_DETAILS}" | jq -r ".[] | select(.OutputKey==\"S3AccessPolicyArn\") .OutputValue")
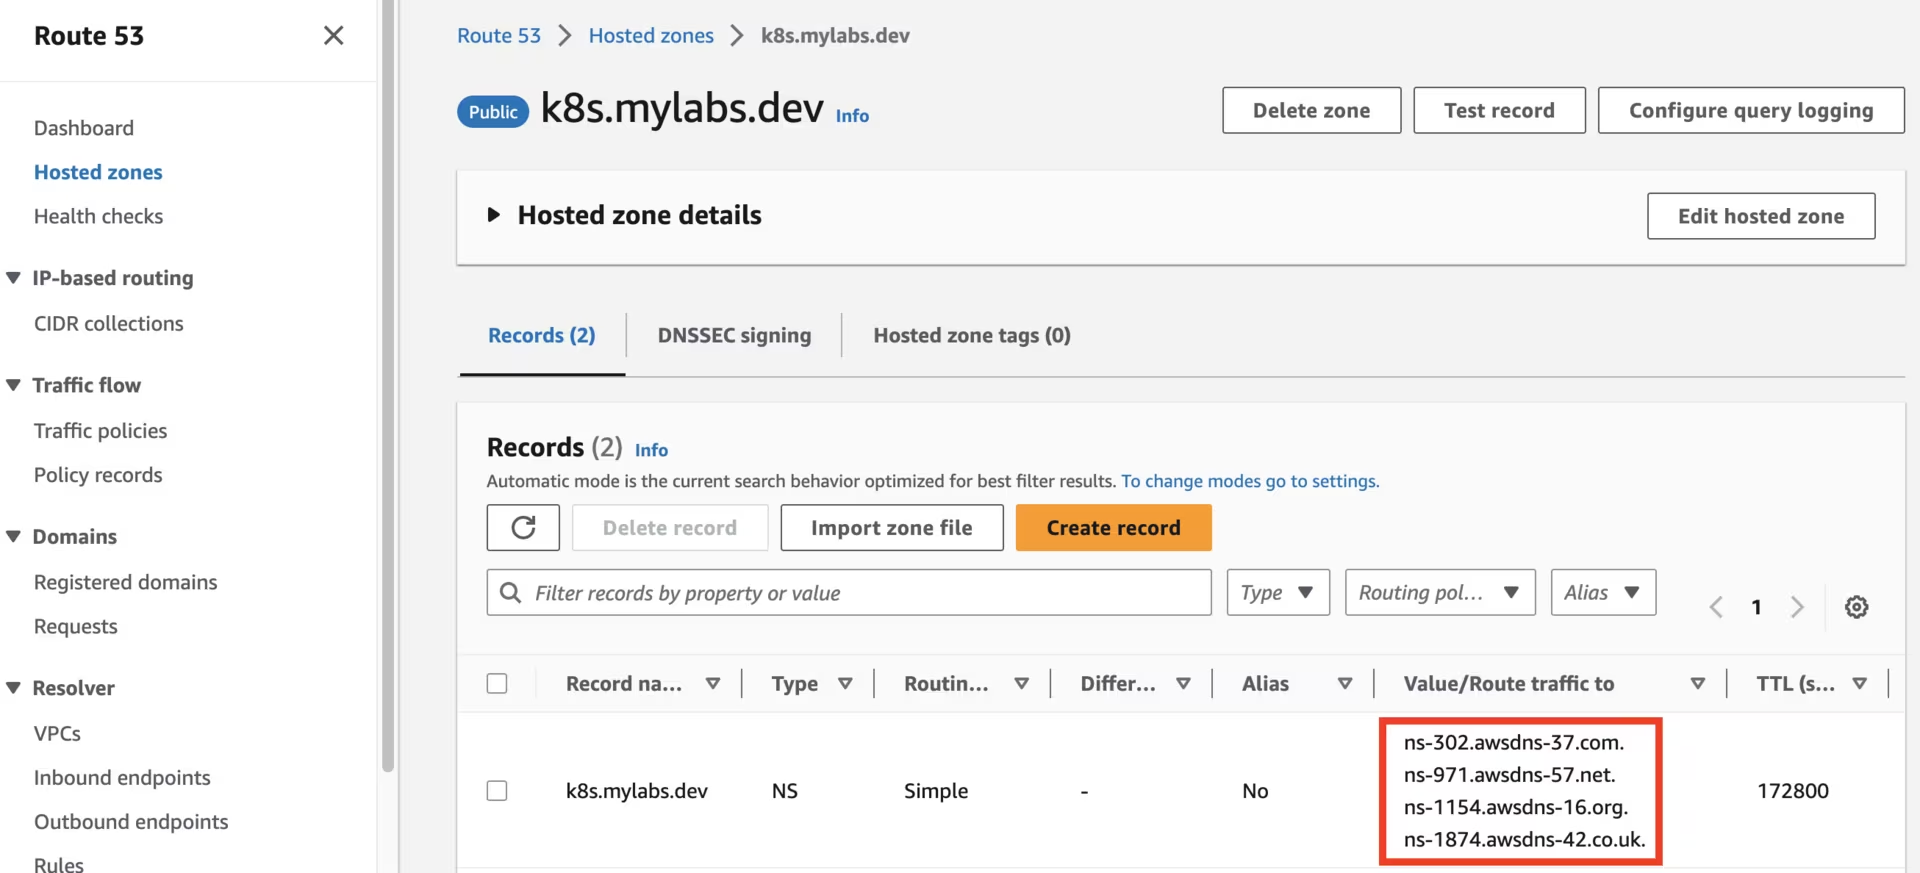
After running the CloudFormation stack, you should see the following Route53 zones:
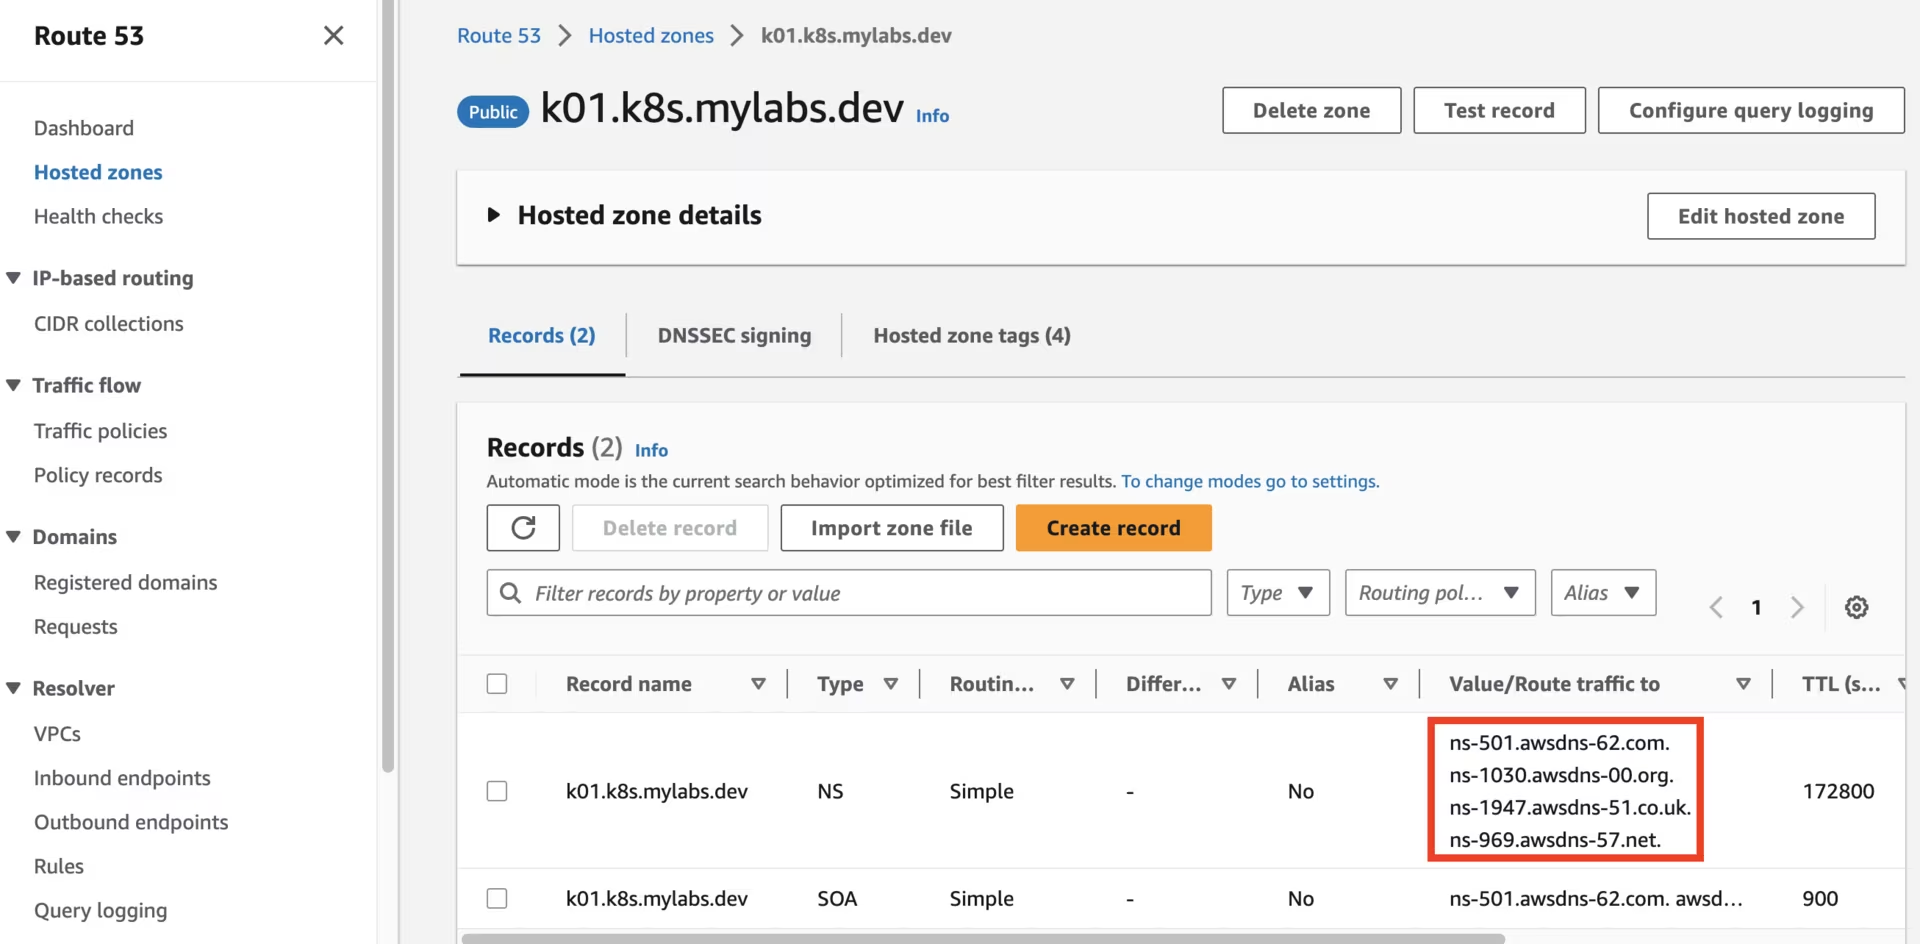 Route53 k01.k8s.mylabs.dev zone
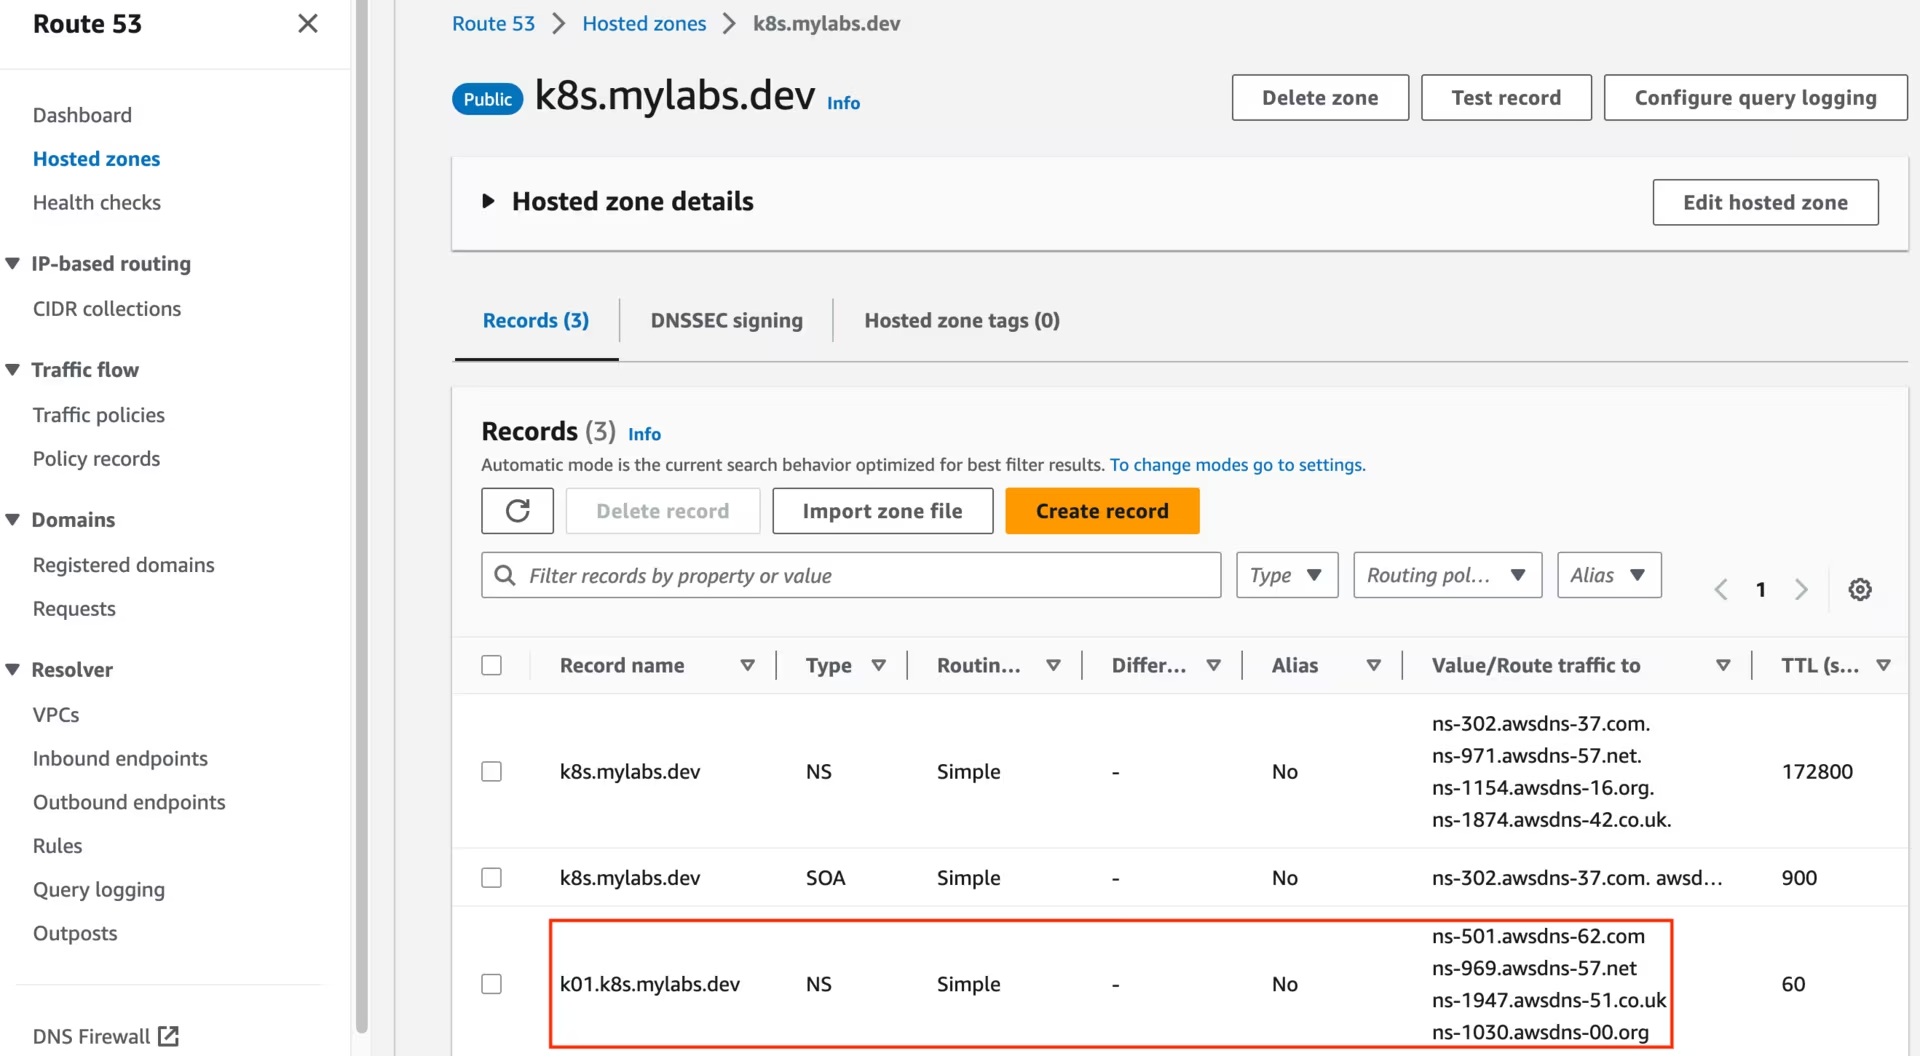 Route53 k8s.mylabs.dev zone
You should also see the following KMS key:
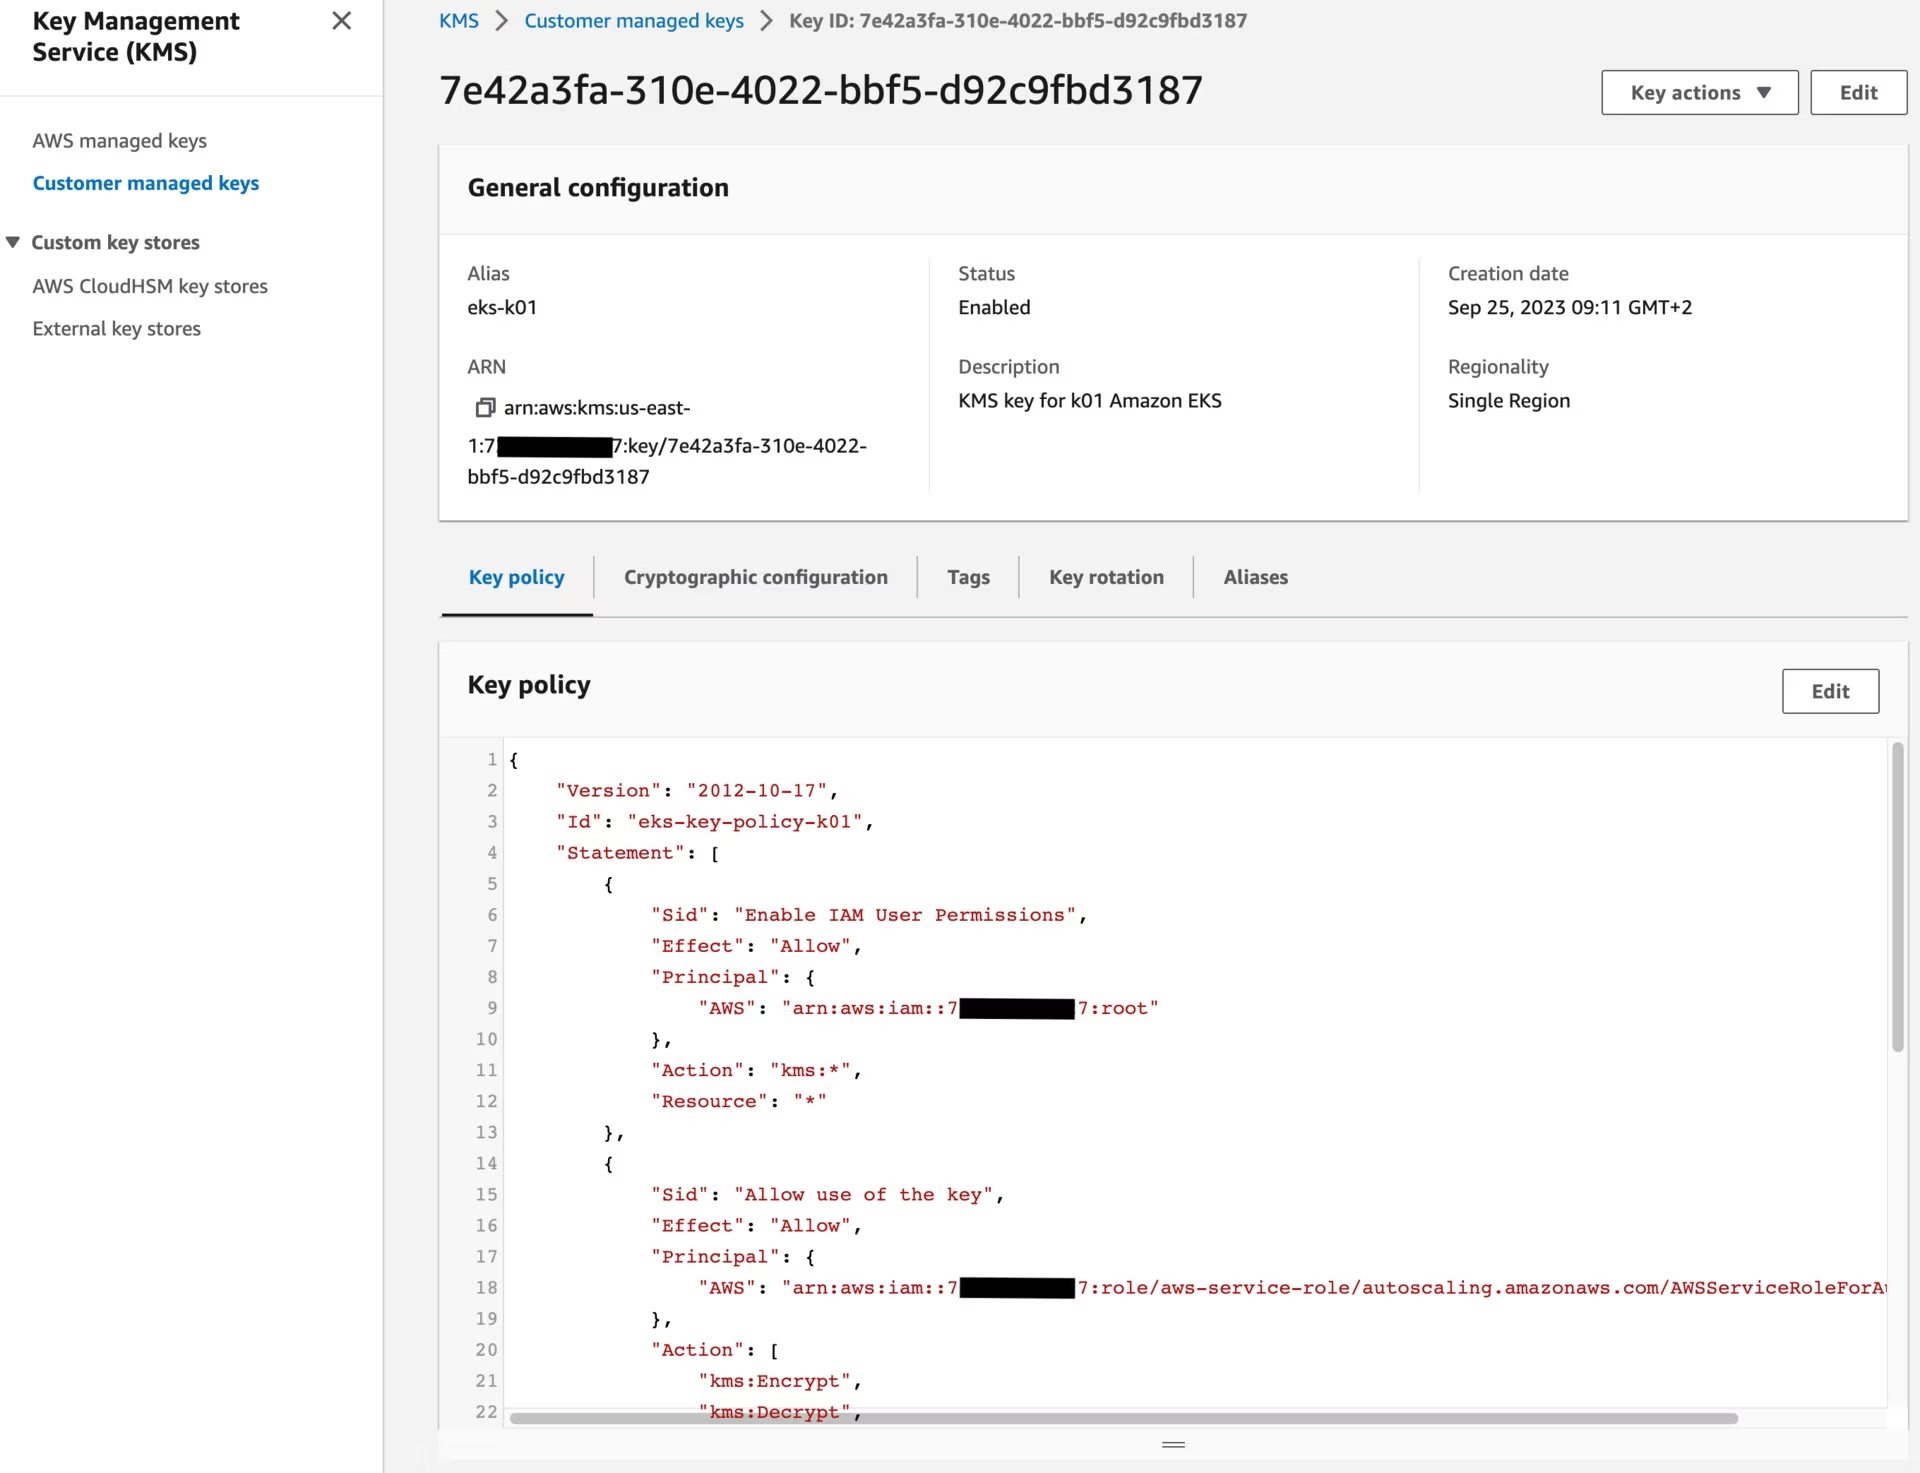 KMS key
Create Karpenter infrastructure
Use CloudFormation to set up the infrastructure needed by the EKS cluster. See CloudFormation for a complete description of what cloudformation.yaml does for Karpenter.
1
2
3
4
5
6
curl -fsSL https://raw.githubusercontent.com/aws/karpenter-provider-aws/refs/heads/main/website/content/en/v1.8/getting-started/getting-started-with-karpenter/cloudformation.yaml > "${TMP_DIR}/${CLUSTER_FQDN}/cloudformation-karpenter.yml"
eval aws cloudformation deploy \
  --stack-name "${CLUSTER_NAME}-karpenter" \
  --template-file "${TMP_DIR}/${CLUSTER_FQDN}/cloudformation-karpenter.yml" \
  --capabilities CAPABILITY_NAMED_IAM \
  --parameter-overrides "ClusterName=${CLUSTER_NAME}" --tags "${TAGS//,/ }"
Create Amazon EKS
I will use eksctl to create the Amazon EKS cluster.

1
2
3
4
5
6
7
8
9
10
11
12
13
14
15
16
17
18
19
20
21
22
23
24
25
26
27
28
29
30
31
32
33
34
35
36
37
38
39
40
41
42
43
44
45
46
47
48
49
50
51
52
53
54
55
56
57
58
59
60
61
62
63
64
65
66
67
68
69
70
71
72
73
74
75
76
77
78
79
80
81
82
83
84
85
86
87
88
89
90
91
92
93
94
95
96
97
98
99
100
101
102
103
104
105
106
107
108
109
110
111
112
113
114
115
116
117
118
119
120
121
122
123
124
125
126
127
tee "${TMP_DIR}/${CLUSTER_FQDN}/eksctl-${CLUSTER_NAME}.yml" << EOF
apiVersion: eksctl.io/v1alpha5
kind: ClusterConfig
metadata:
  name: ${CLUSTER_NAME}
  region: ${AWS_REGION}
  tags:
    karpenter.sh/discovery: ${CLUSTER_NAME}
    $(echo "${TAGS}" | sed "s/,/\\n    /g; s/=/: /g")
availabilityZones:
  - ${AWS_REGION}a
  - ${AWS_REGION}b
accessConfig:
  accessEntries:
    - principalARN: arn:${AWS_PARTITION}:iam::${AWS_ACCOUNT_ID}:role/admin
      accessPolicies:
        - policyARN: arn:${AWS_PARTITION}:eks::aws:cluster-access-policy/AmazonEKSClusterAdminPolicy
          accessScope:
            type: cluster
iam:
  withOIDC: true
  podIdentityAssociations:
    - namespace: aws-load-balancer-controller
      serviceAccountName: aws-load-balancer-controller
      roleName: eksctl-${CLUSTER_NAME}-aws-load-balancer-controller
      wellKnownPolicies:
        awsLoadBalancerController: true
    - namespace: cert-manager
      serviceAccountName: cert-manager
      roleName: eksctl-${CLUSTER_NAME}-cert-manager
      wellKnownPolicies:
        certManager: true
    - namespace: external-dns
      serviceAccountName: external-dns
      roleName: eksctl-${CLUSTER_NAME}-external-dns
      wellKnownPolicies:
        externalDNS: true
    - namespace: karpenter
      serviceAccountName: karpenter
      roleName: eksctl-${CLUSTER_NAME}-karpenter
      permissionPolicyARNs:
        - arn:${AWS_PARTITION}:iam::${AWS_ACCOUNT_ID}:policy/KarpenterControllerPolicy-${CLUSTER_NAME}
    - namespace: loki
      serviceAccountName: loki
      roleName: eksctl-${CLUSTER_NAME}-loki
      permissionPolicyARNs:
        - ${AWS_S3_ACCESS_POLICY_ARN}
    - namespace: mimir
      serviceAccountName: mimir
      roleName: eksctl-${CLUSTER_NAME}-mimir
      permissionPolicyARNs:
        - ${AWS_S3_ACCESS_POLICY_ARN}
    - namespace: tempo
      serviceAccountName: tempo
      roleName: eksctl-${CLUSTER_NAME}-tempo
      permissionPolicyARNs:
        - ${AWS_S3_ACCESS_POLICY_ARN}
    - namespace: velero
      serviceAccountName: velero
      roleName: eksctl-${CLUSTER_NAME}-velero
      permissionPolicyARNs:
        - ${AWS_S3_ACCESS_POLICY_ARN}
      permissionPolicy:
        Version: "2012-10-17"
        Statement:
          - Effect: Allow
            Action: [
              "ec2:DescribeVolumes",
              "ec2:DescribeSnapshots",
              "ec2:CreateTags",
              "ec2:CreateSnapshot",
              "ec2:DeleteSnapshots"
            ]
            Resource:
              - "*"
iamIdentityMappings:
  - arn: "arn:${AWS_PARTITION}:iam::${AWS_ACCOUNT_ID}:role/KarpenterNodeRole-${CLUSTER_NAME}"
    username: system:node:
    groups:
      - system:bootstrappers
      - system:nodes
addons:
  - name: coredns
  - name: eks-pod-identity-agent
  - name: kube-proxy
  - name: snapshot-controller
  - name: aws-ebs-csi-driver
    configurationValues: |-
      defaultStorageClass:
        enabled: true
      controller:
        extraVolumeTags:
          $(echo "${TAGS}" | sed "s/,/\\n          /g; s/=/: /g")
        loggingFormat: json
  - name: vpc-cni
    configurationValues: |-
      enableNetworkPolicy: "true"
      env:
        ENABLE_PREFIX_DELEGATION: "true"
managedNodeGroups:
  - name: mng01-ng
    amiFamily: Bottlerocket
    instanceType: t4g.medium
    desiredCapacity: 2
    availabilityZones:
      - ${AWS_REGION}a
    minSize: 2
    maxSize: 3
    volumeSize: 20
    volumeEncrypted: true
    volumeKmsKeyID: ${AWS_KMS_KEY_ID}
    privateNetworking: true
    nodeRepairConfig:
      enabled: true
    bottlerocket:
      settings:
        kubernetes:
          seccomp-default: true
secretsEncryption:
  keyARN: ${AWS_KMS_KEY_ARN}
cloudWatch:
  clusterLogging:
    logRetentionInDays: 1
    enableTypes:
      - all
EOF
eksctl create cluster --config-file "${TMP_DIR}/${CLUSTER_FQDN}/eksctl-${CLUSTER_NAME}.yml" --kubeconfig "${KUBECONFIG}" || eksctl utils write-kubeconfig --cluster="${CLUSTER_NAME}" --kubeconfig "${KUBECONFIG}"
Enhance the security posture of the EKS cluster by addressing the following concerns:
1
2
3
AWS_VPC_ID=$(aws ec2 describe-vpcs --filters "Name=tag:alpha.eksctl.io/cluster-name,Values=${CLUSTER_NAME}" --query 'Vpcs[*].VpcId' --output text)
AWS_SECURITY_GROUP_ID=$(aws ec2 describe-security-groups --filters "Name=vpc-id,Values=${AWS_VPC_ID}" "Name=group-name,Values=default" --query 'SecurityGroups[*].GroupId' --output text)
AWS_NACL_ID=$(aws ec2 describe-network-acls --filters "Name=vpc-id,Values=${AWS_VPC_ID}" --query 'NetworkAcls[*].NetworkAclId' --output text)
The default security group should have no rules configured:
1
2
aws ec2 revoke-security-group-egress --group-id "${AWS_SECURITY_GROUP_ID}" --protocol all --port all --cidr 0.0.0.0/0 | jq || true
aws ec2 revoke-security-group-ingress --group-id "${AWS_SECURITY_GROUP_ID}" --protocol all --port all --source-group "${AWS_SECURITY_GROUP_ID}" | jq || true
The VPC should have Route 53 DNS resolver with logging enabled:
1
2
3
4
5
6
7
8
9
AWS_CLUSTER_LOG_GROUP_ARN=$(aws logs describe-log-groups --query "logGroups[?logGroupName=='/aws/eks/${CLUSTER_NAME}/cluster'].arn" --output text)
AWS_CLUSTER_ROUTE53_RESOLVER_QUERY_LOG_CONFIG_ID=$(aws route53resolver create-resolver-query-log-config \
  --name "${CLUSTER_NAME}-vpc-dns-logs" \
  --destination-arn "${AWS_CLUSTER_LOG_GROUP_ARN}" \
  --creator-request-id "$(uuidgen)" --query 'ResolverQueryLogConfig.Id' --output text)

aws route53resolver associate-resolver-query-log-config \
  --resolver-query-log-config-id "${AWS_CLUSTER_ROUTE53_RESOLVER_QUERY_LOG_CONFIG_ID}" \
  --resource-id "${AWS_VPC_ID}"
Remove overly permissive NACL rules to follow the principle of least privilege:
1
2
3
4
5
6
7
8
9
10
11
12
13
14
15
16
17
18
19
20
21
22
23
24
25
26
27
28
29
30
31
32
33
# Delete the overly permissive inbound rule
aws ec2 delete-network-acl-entry \
  --network-acl-id "${AWS_NACL_ID}" \
  --rule-number 100 \
  --ingress

# Create restrictive inbound TCP rules
NACL_RULES=(
  "100 443 443 0.0.0.0/0"
  "110 80 80 0.0.0.0/0"
  "120 1024 65535 0.0.0.0/0"
)

for RULE in "${NACL_RULES[@]}"; do
  read -r RULE_NUM PORT_FROM PORT_TO CIDR <<< "${RULE}"
  aws ec2 create-network-acl-entry \
    --network-acl-id "${AWS_NACL_ID}" \
    --rule-number "${RULE_NUM}" \
    --protocol "tcp" \
    --port-range "From=${PORT_FROM},To=${PORT_TO}" \
    --cidr-block "${CIDR}" \
    --rule-action allow \
    --ingress
done

# Allow all traffic from VPC CIDR
aws ec2 create-network-acl-entry \
  --network-acl-id "${AWS_NACL_ID}" \
  --rule-number 130 \
  --protocol "all" \
  --cidr-block "192.168.0.0/16" \
  --rule-action allow \
  --ingress
Prometheus Operator CRDs
Prometheus Operator CRDs provides the Custom Resource Definitions (CRDs) that define the Prometheus operator resources. These CRDs are required before installing ServiceMonitor resources.
Install the prometheus-operator-crds Helm chart to set up the necessary CRDs:
1
helm install prometheus-operator-crds oci://ghcr.io/prometheus-community/charts/prometheus-operator-crds
AWS Load Balancer Controller
The AWS Load Balancer Controller is a controller that manages Elastic Load Balancers for a Kubernetes cluster.
![]()
Install the aws-load-balancer-controller Helm chart and modify its default values:
1
2
3
4
5
6
7
8
9
10
11
12
# renovate: datasource=helm depName=aws-load-balancer-controller registryUrl=https://aws.github.io/eks-charts
AWS_LOAD_BALANCER_CONTROLLER_HELM_CHART_VERSION="1.17.1"

helm repo add --force-update eks https://aws.github.io/eks-charts
tee "${TMP_DIR}/${CLUSTER_FQDN}/helm_values-aws-load-balancer-controller.yml" << EOF
serviceAccount:
  name: aws-load-balancer-controller
clusterName: ${CLUSTER_NAME}
serviceMonitor:
  enabled: true
EOF
helm upgrade --install --version "${AWS_LOAD_BALANCER_CONTROLLER_HELM_CHART_VERSION}" --namespace aws-load-balancer-controller --create-namespace --wait --values "${TMP_DIR}/${CLUSTER_FQDN}/helm_values-aws-load-balancer-controller.yml" aws-load-balancer-controller eks/aws-load-balancer-controller
Pod Scheduling PriorityClasses
Configure PriorityClasses to control the scheduling priority of pods in your cluster. PriorityClasses allow you to influence which pods are scheduled or evicted first when resources are constrained. These classes help ensure that critical workloads receive scheduling priority over less important workloads.
Create custom PriorityClass resources to define priority levels for different workload types:
1
2
3
4
5
6
7
8
9
10
11
12
13
14
15
16
17
tee "${TMP_DIR}/${CLUSTER_FQDN}/k8s-scheduling-priorityclass.yml" << EOF | kubectl apply -f -
apiVersion: scheduling.k8s.io/v1
kind: PriorityClass
metadata:
  name: critical-priority
value: 100001000
globalDefault: false
description: "This priority class should be used for critical workloads only"
---
apiVersion: scheduling.k8s.io/v1
kind: PriorityClass
metadata:
  name: high-priority
value: 100000000
globalDefault: false
description: "This priority class should be used for high priority workloads"
EOF
Add Storage Classes and Volume Snapshots
Configure persistent storage for your EKS cluster by setting up GP3 storage classes and volume snapshot capabilities. This ensures encrypted, expandable storage with proper backup functionality.
1
2
3
4
5
6
7
8
9
10
11
12
13
14
15
16
17
18
19
20
21
22
23
24
25
tee "${TMP_DIR}/${CLUSTER_FQDN}/k8s-storage-snapshot-storageclass-volumesnapshotclass.yml" << EOF | kubectl apply -f -
apiVersion: storage.k8s.io/v1
kind: StorageClass
metadata:
  name: gp3
  annotations:
    storageclass.kubernetes.io/is-default-class: "true"
provisioner: ebs.csi.aws.com
parameters:
  type: gp3
  encrypted: "true"
  kmsKeyId: ${AWS_KMS_KEY_ARN}
reclaimPolicy: Delete
allowVolumeExpansion: true
volumeBindingMode: WaitForFirstConsumer
---
apiVersion: snapshot.storage.k8s.io/v1
kind: VolumeSnapshotClass
metadata:
  name: ebs-vsc
  annotations:
    snapshot.storage.kubernetes.io/is-default-class: "true"
driver: ebs.csi.aws.com
deletionPolicy: Delete
EOF
Delete the gp2 StorageClass, as gp3 will be used instead:
1
kubectl delete storageclass gp2 || true
Karpenter
Karpenter is a Kubernetes node autoscaler built for flexibility, performance, and simplicity.
![]()
Install the karpenter Helm chart and customize its default values to fit your environment and storage backend:
1
2
3
4
5
6
7
8
9
10
11
12
13
14
# renovate: datasource=github-tags depName=aws/karpenter-provider-aws
KARPENTER_HELM_CHART_VERSION="1.8.4"

tee "${TMP_DIR}/${CLUSTER_FQDN}/helm_values-karpenter.yml" << EOF
serviceMonitor:
  enabled: true
settings:
  clusterName: ${CLUSTER_NAME}
  eksControlPlane: true
  interruptionQueue: ${CLUSTER_NAME}
  featureGates:
    spotToSpotConsolidation: true
EOF
helm upgrade --install --version "${KARPENTER_HELM_CHART_VERSION}" --namespace karpenter --create-namespace --values "${TMP_DIR}/${CLUSTER_FQDN}/helm_values-karpenter.yml" karpenter oci://public.ecr.aws/karpenter/karpenter
Configure Karpenter by applying the following provisioner definition:
1
2
3
4
5
6
7
8
9
10
11
12
13
14
15
16
17
18
19
20
21
22
23
24
25
26
27
28
29
30
31
32
33
34
35
36
37
38
39
40
41
42
43
44
45
46
47
48
49
50
51
52
53
54
55
56
57
58
59
60
61
62
63
tee "${TMP_DIR}/${CLUSTER_FQDN}/k8s-karpenter-nodepool.yml" << EOF | kubectl apply -f -
apiVersion: karpenter.k8s.aws/v1
kind: EC2NodeClass
metadata:
  name: default
spec:
  amiFamily: Bottlerocket
  amiSelectorTerms:
    - alias: bottlerocket@latest
  subnetSelectorTerms:
    - tags:
        karpenter.sh/discovery: "${CLUSTER_NAME}"
  securityGroupSelectorTerms:
    - tags:
        karpenter.sh/discovery: "${CLUSTER_NAME}"
  role: "KarpenterNodeRole-${CLUSTER_NAME}"
  tags:
    Name: "${CLUSTER_NAME}-karpenter"
    $(echo "${TAGS}" | sed "s/,/\\n    /g; s/=/: /g")
  blockDeviceMappings:
    - deviceName: /dev/xvda
      ebs:
        volumeSize: 2Gi
        volumeType: gp3
        encrypted: true
        kmsKeyID: ${AWS_KMS_KEY_ARN}
    - deviceName: /dev/xvdb
      ebs:
        volumeSize: 20Gi
        volumeType: gp3
        encrypted: true
        kmsKeyID: ${AWS_KMS_KEY_ARN}
---
apiVersion: karpenter.sh/v1
kind: NodePool
metadata:
  name: default
spec:
  template:
    spec:
      requirements:
        # keep-sorted start
        - key: "karpenter.k8s.aws/instance-memory"
          operator: Gt
          values: ["4095"]
        - key: "topology.kubernetes.io/zone"
          operator: In
          values: ["${AWS_REGION}a"]
        - key: karpenter.k8s.aws/instance-family
          operator: In
          values: ["t4g", "t3a"]
        - key: karpenter.sh/capacity-type
          operator: In
          values: ["spot", "on-demand"]
        - key: kubernetes.io/arch
          operator: In
          values: ["arm64", "amd64"]
        # keep-sorted end
      nodeClassRef:
        group: karpenter.k8s.aws
        kind: EC2NodeClass
        name: default
EOF
cert-manager
cert-manager adds certificates and certificate issuers as resource types in Kubernetes clusters and simplifies the process of obtaining, renewing, and using those certificates.
![]()
Install the cert-manager Helm chart and modify its default values:
1
2
3
4
5
6
7
8
9
10
11
12
13
14
15
16
17
18
19
20
21
22
23
24
25
26
27
28
29
# renovate: datasource=helm depName=cert-manager registryUrl=https://charts.jetstack.io extractVersion=^(?<version>.+)$
CERT_MANAGER_HELM_CHART_VERSION="v1.19.1"

helm repo add --force-update jetstack https://charts.jetstack.io
tee "${TMP_DIR}/${CLUSTER_FQDN}/helm_values-cert-manager.yml" << EOF
global:
  priorityClassName: high-priority
crds:
  enabled: true
extraArgs:
  - --enable-certificate-owner-ref=true
serviceAccount:
  name: cert-manager
enableCertificateOwnerRef: true
webhook:
  replicaCount: 2
  affinity:
    podAntiAffinity:
      requiredDuringSchedulingIgnoredDuringExecution:
      - labelSelector:
          matchLabels:
            app.kubernetes.io/instance: cert-manager
            app.kubernetes.io/component: webhook
        topologyKey: kubernetes.io/hostname
prometheus:
  servicemonitor:
    enabled: true
EOF
helm upgrade --install --version "${CERT_MANAGER_HELM_CHART_VERSION}" --namespace cert-manager --create-namespace --values "${TMP_DIR}/${CLUSTER_FQDN}/helm_values-cert-manager.yml" cert-manager jetstack/cert-manager
Velero
Velero is an open-source tool for backing up and restoring Kubernetes cluster resources and persistent volumes. It enables disaster recovery, data migration, and scheduled backups by integrating with cloud storage providers such as AWS S3.

Install the velero Helm chart and modify its default values:
1
2
3
4
5
6
7
8
9
10
11
12
13
14
15
16
17
18
19
20
21
22
23
24
25
26
27
28
29
30
31
32
33
34
35
36
37
38
39
40
41
42
43
44
45
46
47
48
49
50
51
52
53
54
55
56
57
58
59
60
61
62
63
64
65
66
67
68
69
70
71
72
73
74
75
76
77
78
79
80
81
82
83
84
85
86
87
88
89
90
# renovate: datasource=helm depName=velero registryUrl=https://vmware-tanzu.github.io/helm-charts
VELERO_HELM_CHART_VERSION="11.3.2"

helm repo add --force-update vmware-tanzu https://vmware-tanzu.github.io/helm-charts
cat > "${TMP_DIR}/${CLUSTER_FQDN}/helm_values-velero.yml" << EOF
initContainers:
  - name: velero-plugin-for-aws
    # renovate: datasource=github-tags depName=vmware-tanzu/velero-plugin-for-aws extractVersion=^(?<version>.+)$
    image: velero/velero-plugin-for-aws:v1.13.1
    volumeMounts:
      - mountPath: /target
        name: plugins
priorityClassName: high-priority
metrics:
  serviceMonitor:
    enabled: true
  prometheusRule:
    enabled: true
    spec:
      - alert: VeleroBackupPartialFailures
        annotations:
          message: Velero backup {{ \$labels.schedule }} has {{ \$value | humanizePercentage }} partially failed backups.
        expr: velero_backup_partial_failure_total{schedule!=""} / velero_backup_attempt_total{schedule!=""} > 0.25
        for: 15m
        labels:
          severity: warning
      - alert: VeleroBackupFailures
        annotations:
          message: Velero backup {{ \$labels.schedule }} has {{ \$value | humanizePercentage }} failed backups.
        expr: velero_backup_failure_total{schedule!=""} / velero_backup_attempt_total{schedule!=""} > 0.25
        for: 15m
        labels:
          severity: warning
      - alert: VeleroBackupSnapshotFailures
        annotations:
          message: Velero backup {{ \$labels.schedule }} has {{ \$value | humanizePercentage }} failed snapshot backups.
        expr: increase(velero_volume_snapshot_failure_total{schedule!=""}[1h]) > 0
        for: 15m
        labels:
          severity: warning
      - alert: VeleroRestorePartialFailures
        annotations:
          message: Velero restore {{ \$labels.schedule }} has {{ \$value | humanizePercentage }} partially failed restores.
        expr: increase(velero_restore_partial_failure_total{schedule!=""}[1h]) > 0
        for: 15m
        labels:
          severity: warning
      - alert: VeleroRestoreFailures
        annotations:
          message: Velero restore {{ \$labels.schedule }} has {{ \$value | humanizePercentage }} failed restores.
        expr: increase(velero_restore_failure_total{schedule!=""}[1h]) > 0
        for: 15m
        labels:
          severity: warning
configuration:
  backupStorageLocation:
    - name:
      provider: aws
      bucket: ${CLUSTER_FQDN}
      prefix: velero
      config:
        region: ${AWS_REGION}
  volumeSnapshotLocation:
    - name:
      provider: aws
      config:
        region: ${AWS_REGION}
serviceAccount:
  server:
    name: velero
credentials:
  useSecret: false
# Create scheduled backup to periodically backup the let's encrypt production resources in the "cert-manager" namespace:
schedules:
  monthly-backup-cert-manager-production:
    labels:
      letsencrypt: production
    schedule: "@monthly"
    template:
      ttl: 2160h
      includedNamespaces:
        - cert-manager
      includedResources:
        - certificates.cert-manager.io
        - secrets
      labelSelector:
        matchLabels:
          letsencrypt: production
EOF
helm upgrade --install --version "${VELERO_HELM_CHART_VERSION}" --namespace velero --create-namespace --wait --values "${TMP_DIR}/${CLUSTER_FQDN}/helm_values-velero.yml" velero vmware-tanzu/velero
Restore cert-manager objects
The following steps will guide you through restoring a Let’s Encrypt production certificate, previously backed up by Velero to S3, onto a new cluster.
Initiate the restore process for the cert-manager objects.
1
2
while [ -z "$(kubectl -n velero get backupstoragelocations default -o jsonpath='{.status.lastSyncedTime}')" ]; do sleep 5; done
velero restore create --from-schedule velero-monthly-backup-cert-manager-production --labels letsencrypt=production --wait --existing-resource-policy=update
View details about the restore process:
1
velero restore describe --selector letsencrypt=production --details
1
2
3
4
5
6
7
8
9
10
11
12
13
14
15
16
17
18
19
20
21
22
23
24
25
26
27
28
29
30
31
32
33
34
35
36
37
38
39
40
41
42
43
44
45
46
47
48
49
50
Name:         velero-monthly-backup-cert-manager-production-20251030075321
Namespace:    velero
Labels:       letsencrypt=production
Annotations:  <none>

Phase:                       Completed
Total items to be restored:  3
Items restored:              3

Started:    2025-10-30 07:53:22 +0100 CET
Completed:  2025-10-30 07:53:24 +0100 CET

Backup:  velero-monthly-backup-cert-manager-production-20250921155028

Namespaces:
  Included:  all namespaces found in the backup
  Excluded:  <none>

Resources:
  Included:        *
  Excluded:        nodes, events, events.events.k8s.io, backups.velero.io, restores.velero.io, resticrepositories.velero.io, csinodes.storage.k8s.io, volumeattachments.storage.k8s.io, backuprepositories.velero.io
  Cluster-scoped:  auto

Namespace mappings:  <none>

Label selector:  <none>

Or label selector:  <none>

Restore PVs:  auto

CSI Snapshot Restores: <none included>

Existing Resource Policy:   update
ItemOperationTimeout:       4h0m0s

Preserve Service NodePorts:  auto

Uploader config:


HooksAttempted:   0
HooksFailed:      0

Resource List:
  cert-manager.io/v1/Certificate:
    - cert-manager/ingress-cert-production(created)
  v1/Secret:
    - cert-manager/ingress-cert-production(created)
    - cert-manager/letsencrypt-production-dns(created)
Verify that the certificate was restored properly:
1
kubectl describe certificates -n cert-manager ingress-cert-production
1
2
3
4
5
6
7
8
9
10
11
12
13
14
15
16
17
18
19
20
21
22
23
24
25
26
27
28
29
30
31
32
33
34
35
36
37
38
Name:         ingress-cert-production
Namespace:    cert-manager
Labels:       letsencrypt=production
              velero.io/backup-name=velero-monthly-backup-cert-manager-production-20250921155028
              velero.io/restore-name=velero-monthly-backup-cert-manager-production-20251030075321
Annotations:  <none>
API Version:  cert-manager.io/v1
Kind:         Certificate
Metadata:
  Creation Timestamp:  2025-10-30T06:53:23Z
  Generation:          1
  Resource Version:    5521
  UID:                 33422558-3105-4936-87d8-468befb5dc2b
Spec:
  Common Name:  *.k01.k8s.mylabs.dev
  Dns Names:
    *.k01.k8s.mylabs.dev
    k01.k8s.mylabs.dev
  Issuer Ref:
    Group:      cert-manager.io
    Kind:       ClusterIssuer
    Name:       letsencrypt-production-dns
  Secret Name:  ingress-cert-production
  Secret Template:
    Labels:
      Letsencrypt:  production
Status:
  Conditions:
    Last Transition Time:  2025-10-30T06:53:23Z
    Message:               Certificate is up to date and has not expired
    Observed Generation:   1
    Reason:                Ready
    Status:                True
    Type:                  Ready
  Not After:               2025-12-20T10:53:07Z
  Not Before:              2025-09-21T10:53:08Z
  Renewal Time:            2025-11-20T10:53:07Z
Events:                    <none>
ExternalDNS
ExternalDNS synchronizes exposed Kubernetes Services and Ingresses with DNS providers.
ExternalDNS will manage the DNS records. Install the external-dns Helm chart and modify its default values:
1
2
3
4
5
6
7
8
9
10
11
12
13
14
15
16
# renovate: datasource=helm depName=external-dns registryUrl=https://kubernetes-sigs.github.io/external-dns/
EXTERNAL_DNS_HELM_CHART_VERSION="1.20.0"

helm repo add --force-update external-dns https://kubernetes-sigs.github.io/external-dns/
tee "${TMP_DIR}/${CLUSTER_FQDN}/helm_values-external-dns.yml" << EOF
serviceAccount:
  name: external-dns
priorityClassName: high-priority
serviceMonitor:
  enabled: true
interval: 20s
policy: sync
domainFilters:
  - ${CLUSTER_FQDN}
EOF
helm upgrade --install --version "${EXTERNAL_DNS_HELM_CHART_VERSION}" --namespace external-dns --create-namespace --values "${TMP_DIR}/${CLUSTER_FQDN}/helm_values-external-dns.yml" external-dns external-dns/external-dns
Ingress NGINX Controller
ingress-nginx is an Ingress controller for Kubernetes that uses nginx as a reverse proxy and load balancer.
Install the ingress-nginx Helm chart and modify its default values:
1
2
3
4
5
6
7
8
9
10
11
12
13
14
15
16
17
18
19
20
21
22
23
24
25
26
27
28
29
30
31
32
33
34
35
36
37
38
39
40
41
42
43
44
45
46
47
48
49
50
51
52
53
54
55
56
57
58
59
60
61
62
63
64
65
66
67
68
69
70
71
72
73
74
75
# renovate: datasource=helm depName=ingress-nginx registryUrl=https://kubernetes.github.io/ingress-nginx
INGRESS_NGINX_HELM_CHART_VERSION="4.14.1"

helm repo add --force-update ingress-nginx https://kubernetes.github.io/ingress-nginx
tee "${TMP_DIR}/${CLUSTER_FQDN}/helm_values-ingress-nginx.yml" << EOF
controller:
  config:
    annotations-risk-level: Critical
    use-proxy-protocol: true
  allowSnippetAnnotations: true
  ingressClassResource:
    default: true
  extraArgs:
    default-ssl-certificate: cert-manager/ingress-cert-production
  affinity:
    podAntiAffinity:
      requiredDuringSchedulingIgnoredDuringExecution:
      - labelSelector:
          matchLabels:
            app.kubernetes.io/instance: ingress-nginx
            app.kubernetes.io/component: controller
        topologyKey: kubernetes.io/hostname
  replicaCount: 2
  service:
    annotations:
      # https://www.qovery.com/blog/our-migration-from-kubernetes-built-in-nlb-to-alb-controller/
      # https://www.youtube.com/watch?v=xwiRjimKW9c
      service.beta.kubernetes.io/aws-load-balancer-additional-resource-tags: ${TAGS//\'/}
      service.beta.kubernetes.io/aws-load-balancer-name: eks-${CLUSTER_NAME}
      service.beta.kubernetes.io/aws-load-balancer-nlb-target-type: ip
      service.beta.kubernetes.io/aws-load-balancer-scheme: internet-facing
      service.beta.kubernetes.io/aws-load-balancer-target-group-attributes: proxy_protocol_v2.enabled=true
      service.beta.kubernetes.io/aws-load-balancer-type: external
  metrics:
    enabled: true
    serviceMonitor:
      enabled: true
    prometheusRule:
      enabled: true
      rules:
        - alert: NGINXConfigFailed
          expr: count(nginx_ingress_controller_config_last_reload_successful == 0) > 0
          for: 1s
          labels:
            severity: critical
          annotations:
            description: bad ingress config - nginx config test failed
            summary: uninstall the latest ingress changes to allow config reloads to resume
        - alert: NGINXCertificateExpiry
          expr: (avg(nginx_ingress_controller_ssl_expire_time_seconds{host!="_"}) by (host) - time()) < 604800
          for: 1s
          labels:
            severity: critical
          annotations:
            description: ssl certificate(s) will expire in less then a week
            summary: renew expiring certificates to avoid downtime
        - alert: NGINXTooMany500s
          expr: 100 * ( sum( nginx_ingress_controller_requests{status=~"5.+"} ) / sum(nginx_ingress_controller_requests) ) > 5
          for: 1m
          labels:
            severity: warning
          annotations:
            description: Too many 5XXs
            summary: More than 5% of all requests returned 5XX, this requires your attention
        - alert: NGINXTooMany400s
          expr: 100 * ( sum( nginx_ingress_controller_requests{status=~"4.+"} ) / sum(nginx_ingress_controller_requests) ) > 5
          for: 1m
          labels:
            severity: warning
          annotations:
            description: Too many 4XXs
            summary: More than 5% of all requests returned 4XX, this requires your attention
  priorityClassName: critical-priority
EOF
helm upgrade --install --version "${INGRESS_NGINX_HELM_CHART_VERSION}" --namespace ingress-nginx --create-namespace --wait --values "${TMP_DIR}/${CLUSTER_FQDN}/helm_values-ingress-nginx.yml" ingress-nginx ingress-nginx/ingress-nginx
Mimir
Grafana Mimir is an open source, horizontally scalable, multi-tenant time series database for Prometheus metrics, designed for high availability and cost efficiency. It enables you to centralize metrics from multiple clusters or environments, and integrates seamlessly with Grafana dashboards for visualization and alerting.
![]()
Install the mimir-distributed Helm chart and customize its default values to fit your environment and storage backend:
1
2
3
4
5
6
7
8
9
10
11
12
13
14
15
16
17
18
19
20
21
22
23
24
25
26
27
28
29
30
31
32
33
34
35
36
37
38
39
40
41
42
43
44
45
46
47
48
49
50
51
52
53
54
55
56
57
58
59
60
61
62
63
64
65
66
67
68
69
70
71
72
73
74
75
76
77
78
79
80
81
82
83
84
85
86
87
88
89
90
91
92
93
94
95
96
97
98
99
100
101
102
103
104
105
106
107
108
109
110
111
112
113
114
115
116
117
118
119
120
121
122
123
124
125
126
127
128
129
130
131
132
133
134
135
136
137
138
139
140
141
142
143
144
145
146
147
148
149
150
151
152
153
154
155
156
157
158
159
160
161
162
163
164
165
166
167
168
169
170
171
172
173
174
175
176
177
178
179
180
181
182
183
184
185
186
187
188
189
190
191
192
193
194
195
196
197
198
199
200
201
202
203
204
205
206
207
208
209
210
211
212
# renovate: datasource=helm depName=mimir-distributed registryUrl=https://grafana.github.io/helm-charts
MIMIR_DISTRIBUTED_HELM_CHART_VERSION="6.1.0-weekly.376"

helm repo add --force-update grafana https://grafana.github.io/helm-charts
tee "${TMP_DIR}/${CLUSTER_FQDN}/helm_values-mimir-distributed.yml" << EOF
serviceAccount:
  name: mimir
mimir:
  structuredConfig:
    multitenancy_enabled: false
    limits:
      compactor_blocks_retention_period: 30d
      # "err":"server returned HTTP status 400 Bad Request: received a series whose number of labels exceeds the limit (actual: 31, limit: 30) ... (err-mimir-max-label-names-per-series). To adjust the related per-tenant limit, configure -validation.max-label-names-per-series, or contact your service administrator
      max_label_names_per_series: 50
      # Default is 150000
      max_global_series_per_user: 300000
    common:
      # https://grafana.com/docs/mimir/v2.17.x/configure/configuration-parameters/
      storage:
        backend: s3
        s3:
          endpoint: s3.${AWS_REGION}.amazonaws.com
          region: ${AWS_REGION}
          storage_class: ONEZONE_IA
    alertmanager_storage:
      s3:
        bucket_name: ${CLUSTER_FQDN}
      storage_prefix: mimiralertmanager
    blocks_storage:
      s3:
        bucket_name: ${CLUSTER_FQDN}
      storage_prefix: mimirblocks
    ruler_storage:
      s3:
        bucket_name: ${CLUSTER_FQDN}
      storage_prefix: mimirruler
alertmanager:
  priorityClassName: high-priority
  replicas: 2
  affinity:
    podAntiAffinity:
      requiredDuringSchedulingIgnoredDuringExecution:
      - labelSelector:
          matchLabels:
            app.kubernetes.io/component: alertmanager
        topologyKey: kubernetes.io/hostname
distributor:
  priorityClassName: high-priority
  replicas: 2
  affinity:
    podAntiAffinity:
      requiredDuringSchedulingIgnoredDuringExecution:
      - labelSelector:
          matchLabels:
            app.kubernetes.io/component: distributor
        topologyKey: kubernetes.io/hostname
ingester:
  zoneAwareReplication:
    enabled: false
  replicas: 2
  priorityClassName: high-priority
  affinity:
    podAntiAffinity:
      requiredDuringSchedulingIgnoredDuringExecution:
      - labelSelector:
          matchLabels:
            app.kubernetes.io/component: ingester
        topologyKey: kubernetes.io/hostname
overrides_exporter:
  priorityClassName: high-priority
ruler:
  priorityClassName: high-priority
  replicas: 2
  affinity:
    podAntiAffinity:
      requiredDuringSchedulingIgnoredDuringExecution:
      - labelSelector:
          matchLabels:
            app.kubernetes.io/component: ruler
        topologyKey: kubernetes.io/hostname
ruler_querier:
  priorityClassName: high-priority
  replicas: 2
  affinity:
    podAntiAffinity:
      requiredDuringSchedulingIgnoredDuringExecution:
      - labelSelector:
          matchLabels:
            app.kubernetes.io/component: ruler-querier
        topologyKey: kubernetes.io/hostname
ruler_query_frontend:
  priorityClassName: high-priority
  replicas: 2
  affinity:
    podAntiAffinity:
      requiredDuringSchedulingIgnoredDuringExecution:
      - labelSelector:
          matchLabels:
            app.kubernetes.io/component: ruler-query-frontend
        topologyKey: kubernetes.io/hostname
ruler_query_scheduler:
  priorityClassName: high-priority
  replicas: 2
  affinity:
    podAntiAffinity:
      requiredDuringSchedulingIgnoredDuringExecution:
      - labelSelector:
          matchLabels:
            app.kubernetes.io/component: ruler-query-scheduler
        topologyKey: kubernetes.io/hostname
querier:
  priorityClassName: high-priority
  replicas: 2
  affinity:
    podAntiAffinity:
      requiredDuringSchedulingIgnoredDuringExecution:
      - labelSelector:
          matchLabels:
            app.kubernetes.io/component: querier
        topologyKey: kubernetes.io/hostname
query_frontend:
  priorityClassName: high-priority
  replicas: 2
  affinity:
    podAntiAffinity:
      requiredDuringSchedulingIgnoredDuringExecution:
      - labelSelector:
          matchLabels:
            app.kubernetes.io/component: query-frontend
        topologyKey: kubernetes.io/hostname
query_scheduler:
  priorityClassName: high-priority
  replicas: 2
  affinity:
    podAntiAffinity:
      requiredDuringSchedulingIgnoredDuringExecution:
      - labelSelector:
          matchLabels:
            app.kubernetes.io/component: query-scheduler
        topologyKey: kubernetes.io/hostname
store_gateway:
  priorityClassName: high-priority
  replicas: 2
  affinity:
    podAntiAffinity:
      requiredDuringSchedulingIgnoredDuringExecution:
      - labelSelector:
          matchLabels:
            app.kubernetes.io/component: store-gateway
        topologyKey: kubernetes.io/hostname
compactor:
  priorityClassName: high-priority
  replicas: 2
  affinity:
    podAntiAffinity:
      requiredDuringSchedulingIgnoredDuringExecution:
      - labelSelector:
          matchLabels:
            app.kubernetes.io/component: compactor
        topologyKey: kubernetes.io/hostname
# https://github.com/grafana/helm-charts/blob/main/charts/rollout-operator/values.yaml
rollout_operator:
  serviceMonitor:
    enabled: true
  priorityClassName: high-priority
minio:
  enabled: false
kafka:
  # 3 replicas required for Raft quorum (tolerates 1 node failure)
  replicas: 3
  affinity:
    podAntiAffinity:
      requiredDuringSchedulingIgnoredDuringExecution:
      - labelSelector:
          matchLabels:
            app.kubernetes.io/component: kafka
        topologyKey: kubernetes.io/hostname
ingress:
  enabled: true
  ingressClassName: nginx
  annotations:
    gethomepage.dev/enabled: "true"
    gethomepage.dev/description: Grafana Mimir provides horizontally scalable, highly available, multi-tenant, long-term storage for Prometheus
    gethomepage.dev/group: Apps
    gethomepage.dev/icon: https://raw.githubusercontent.com/grafana/mimir/843897414dba909dfd44f5b93dad35a8a6694d06/images/logo.png
    gethomepage.dev/name: Mimir
    nginx.ingress.kubernetes.io/auth-url: https://oauth2-proxy.${CLUSTER_FQDN}/oauth2/auth
    nginx.ingress.kubernetes.io/auth-signin: https://oauth2-proxy.${CLUSTER_FQDN}/oauth2/start?rd=\$scheme://\$host\$request_uri
  hosts:
    - mimir.${CLUSTER_FQDN}
  tls:
    - hosts:
        - mimir.${CLUSTER_FQDN}
gateway:
  priorityClassName: high-priority
  replicas: 2
  affinity:
    podAntiAffinity:
      requiredDuringSchedulingIgnoredDuringExecution:
      - labelSelector:
          matchLabels:
            app.kubernetes.io/component: gateway
        topologyKey: kubernetes.io/hostname
metaMonitoring:
  serviceMonitor:
    enabled: true
  prometheusRule:
    enabled: true
    mimirAlerts: true
    mimirRules: true
EOF
helm upgrade --install --version "${MIMIR_DISTRIBUTED_HELM_CHART_VERSION}" --namespace mimir --create-namespace --values "${TMP_DIR}/${CLUSTER_FQDN}/helm_values-mimir-distributed.yml" mimir grafana/mimir-distributed
Loki
Grafana Loki is a horizontally-scalable, highly-available, multi-tenant log aggregation system inspired by Prometheus. It is designed to be very cost-effective and easy to operate, as it does not index the contents of the logs, but rather a set of labels for each log stream.
![]()
Install the loki Helm chart and customize its default values to fit your environment and storage requirements:
1
2
3
4
5
6
7
8
9
10
11
12
13
14
15
16
17
18
19
20
21
22
23
24
25
26
27
28
29
30
31
32
33
34
35
36
37
38
39
40
41
42
43
44
45
46
47
48
49
50
51
52
53
54
55
56
57
# renovate: datasource=helm depName=loki registryUrl=https://grafana.github.io/helm-charts
LOKI_HELM_CHART_VERSION="6.49.0"

helm repo add --force-update grafana https://grafana.github.io/helm-charts
tee "${TMP_DIR}/${CLUSTER_FQDN}/helm_values-loki.yml" << EOF
global:
  priorityClassName: high-priority
deploymentMode: SingleBinary
loki:
  auth_enabled: false
  commonConfig:
    replication_factor: 2
  storage:
    bucketNames:
      chunks: ${CLUSTER_FQDN}
      ruler: ${CLUSTER_FQDN}
      admin: ${CLUSTER_FQDN}
    s3:
      region: ${AWS_REGION}
  schemaConfig:
    configs:
      - from: 2024-04-01
        store: tsdb
        object_store: s3
        schema: v13
        index:
          prefix: loki_index_
          period: 24h
  storage_config:
    aws:
      region: ${AWS_REGION}
      bucketnames: ${CLUSTER_FQDN}
  limits_config:
    retention_period: 1w
  # Log retention in Loki is achieved through the Compactor (https://grafana.com/docs/loki/v3.5.x/get-started/components/#compactor)
  compactor:
    delete_request_store: s3
    retention_enabled: true
lokiCanary:
  kind: Deployment
gateway:
  replicas: 2
singleBinary:
  replicas: 2
  priorityClassName: high-priority
  persistence:
    size: 5Gi
write:
  replicas: 0
read:
  replicas: 0
backend:
  replicas: 0
ruler:
  priorityClassName: high-priority
EOF
helm upgrade --install --version "${LOKI_HELM_CHART_VERSION}" --namespace loki --create-namespace --values "${TMP_DIR}/${CLUSTER_FQDN}/helm_values-loki.yml" loki grafana/loki
Tempo
Grafana Tempo is an open source, easy-to-use, and high-scale distributed tracing backend. It is designed to be cost-effective and simple to operate, as it only requires object storage to operate its backend and does not index the trace data.
![]()
Install the tempo Helm chart and customize its default values to fit your environment and storage requirements:
1
2
3
4
5
6
7
8
9
10
11
12
13
14
15
16
17
18
19
20
21
22
23
24
25
26
27
28
29
# renovate: datasource=helm depName=tempo registryUrl=https://grafana.github.io/helm-charts
TEMPO_HELM_CHART_VERSION="1.24.3"

helm repo add --force-update grafana https://grafana.github.io/helm-charts
tee "${TMP_DIR}/${CLUSTER_FQDN}/helm_values-tempo.yml" << EOF
replicas: 2
tempo:
  # https://youtu.be/PmE9mgYaoQA?t=817
  metricsGenerator:
    enabled: true
    remoteWriteUrl: http://mimir-gateway.mimir.svc.cluster.local/api/v1/push
  storage:
    trace:
      backend: s3
      s3:
        bucket: ${CLUSTER_FQDN}
        endpoint: s3.${AWS_REGION}.amazonaws.com
serviceMonitor:
  enabled: true
affinity:
  podAntiAffinity:
    requiredDuringSchedulingIgnoredDuringExecution:
      - labelSelector:
          matchLabels:
            app.kubernetes.io/name: tempo
        topologyKey: kubernetes.io/hostname
priorityClassName: high-priority
EOF
helm upgrade --install --version "${TEMPO_HELM_CHART_VERSION}" --namespace tempo --create-namespace --values "${TMP_DIR}/${CLUSTER_FQDN}/helm_values-tempo.yml" tempo grafana/tempo
Pyroscope
Grafana Pyroscope is a Continuous Profiling Platform.
![]()
Install the pyroscope Helm chart and customize its default values to fit your environment and storage requirements:
1
2
3
4
5
6
7
8
9
10
11
12
13
14
15
16
17
18
19
20
21
22
23
24
25
26
27
28
29
30
31
32
33
34
35
36
# renovate: datasource=helm depName=pyroscope registryUrl=https://grafana.github.io/helm-charts
PYROSCOPE_HELM_CHART_VERSION="1.17.0"

helm repo add --force-update grafana https://grafana.github.io/helm-charts
tee "${TMP_DIR}/${CLUSTER_FQDN}/helm_values-pyroscope.yml" << EOF
pyroscope:
  replicaCount: 2
  affinity:
    podAntiAffinity:
      requiredDuringSchedulingIgnoredDuringExecution:
        - labelSelector:
            matchLabels:
              app.kubernetes.io/instance: pyroscope
          topologyKey: kubernetes.io/hostname
  priorityClassName: high-priority
ingress:
  enabled: true
  className: nginx
  annotations:
    gethomepage.dev/enabled: "true"
    gethomepage.dev/description: Continuous Profiling Platform
    gethomepage.dev/group: Observability
    gethomepage.dev/icon: https://raw.githubusercontent.com/grafana/pyroscope/d3818254b7c70a43104effcfd300ff885035ac50/images/logo.png
    gethomepage.dev/name: Pyroscope
    gethomepage.dev/pod-selector: app.kubernetes.io/instance=pyroscope
    nginx.ingress.kubernetes.io/auth-url: https://oauth2-proxy.${CLUSTER_FQDN}/oauth2/auth
    nginx.ingress.kubernetes.io/auth-signin: https://oauth2-proxy.${CLUSTER_FQDN}/oauth2/start?rd=\$scheme://\$host\$request_uri
  hosts:
    - pyroscope.${CLUSTER_FQDN}
  tls:
    - hosts:
        - pyroscope.${CLUSTER_FQDN}
serviceMonitor:
  enabled: true
EOF
helm upgrade --install --version "${PYROSCOPE_HELM_CHART_VERSION}" --namespace pyroscope --create-namespace --values "${TMP_DIR}/${CLUSTER_FQDN}/helm_values-pyroscope.yml" pyroscope grafana/pyroscope
Grafana Kubernetes Monitoring Helm chart
The Grafana Kubernetes Monitoring Helm chart offers a complete solution for configuring infrastructure, zero-code instrumentation, and gathering telemetry.
For additional configuration options, refer to the Helm chart documentation.
Install the k8s-monitoring Helm chart and customize its default values to fit your environment and storage requirements:
1
2
3
4
5
6
7
8
9
10
11
12
13
14
15
16
17
18
19
20
21
22
23
24
25
26
27
28
29
30
31
32
33
34
35
36
37
38
39
40
41
42
43
44
45
46
47
48
49
50
51
52
53
54
55
56
57
58
59
60
61
62
63
64
65
66
67
68
69
70
71
72
73
74
75
76
77
78
79
80
81
82
83
84
85
86
87
88
89
90
91
92
93
94
95
96
97
98
99
100
101
102
103
104
105
106
107
108
109
# renovate: datasource=helm depName=k8s-monitoring registryUrl=https://grafana.github.io/helm-charts
K8S_MONITORING_HELM_CHART_VERSION="3.7.1"

helm repo add --force-update grafana https://grafana.github.io/helm-charts
tee "${TMP_DIR}/${CLUSTER_FQDN}/helm_values-k8s-monitoring.yml" << EOF
# Cluster identification used in metrics labels
cluster:
  name: "${CLUSTER_NAME}"
# Backend destinations where telemetry data will be sent
destinations:
  # Metrics destination - sends to Mimir for long-term storage
  - name: prometheus
    type: prometheus
    url: http://mimir-gateway.mimir.svc.cluster.local/api/v1/push
  # Logs destination - sends to Loki for log aggregation
  - name: loki
    type: loki
    url: http://loki-gateway.loki.svc.cluster.local/loki/api/v1/push
  # Traces destination - sends to Tempo via OTLP protocol
  - name: otlpgateway
    type: otlp
    url: http://tempo.tempo.svc.cluster.local:4317
    tls:
      insecure: true
      insecureSkipVerify: true
  # Profiling destination - sends to Pyroscope for continuous profiling
  - name: pyroscope
    type: pyroscope
    url: http://pyroscope.pyroscope.svc.cluster.local:4040
    tls:
      insecure_skip_verify: true
# Collect K8s cluster-level metrics (nodes, pods, deployments, etc.)
clusterMetrics:
  enabled: true
  # Scrape metrics from the Kubernetes API server (Kubernetes / System / API Server)
  apiServer:
    enabled: true
  # Disable the default allowlist to allow Node Exporter Full dashboard to work properly - all node-exporter metrics will now be collected (https://github.com/grafana/k8s-monitoring-helm/issues/1296)
  node-exporter:
    metricsTuning:
      useDefaultAllowList: false
  windows-exporter:
    enabled: false
    deploy: false
  # Disable the default allowlist for kube-state-metrics to enable all namespace metrics required by "Kubernetes / Views / Global" dashboard (https://github.com/dotdc/grafana-dashboards-kubernetes/issues/176)
  kube-state-metrics:
    metricsTuning:
      useDefaultAllowList: false
# Collect Kubernetes events (pod scheduling, failures, etc.)
clusterEvents:
  enabled: true
# Collect logs from node-level services (kubelet, containerd)
nodeLogs:
  enabled: true
# Collect logs from all pods in the cluster
podLogs:
  enabled: true
# Enable application-level observability (traces and spans)
applicationObservability:
  enabled: true
  # Configure OTLP receivers for ingesting traces from applications
  receivers:
    otlp:
      grpc:
        enabled: true
      http:
        enabled: true
# Automatic instrumentation for supported languages (Java, Python, etc.)
autoInstrumentation:
  enabled: true
# Discover and scrape metrics from pods with Prometheus annotations - https://github.com/grafana/k8s-monitoring-helm/tree/main/charts/k8s-monitoring/docs/examples/features/annotation-autodiscovery/prom-annotations
annotationAutodiscovery:
  enabled: true
  annotations:
    scrape: prometheus.io/scrape
    metricsPath: prometheus.io/path
    metricsPortNumber: prometheus.io/port
    metricsScheme: prometheus.io/scheme
# Support for ServiceMonitor and PodMonitor CRDs from Prometheus Operator
# https://github.com/grafana/k8s-monitoring-helm/tree/main/charts/k8s-monitoring/charts/feature-prometheus-operator-objects
prometheusOperatorObjects:
  enabled: true
# Enable continuous profiling data collection
profiling:
  enabled: true
# Alloy collector for scraping and forwarding metrics
alloy-metrics:
  enabled: true
# Single-instance Alloy for cluster-wide tasks (kube-state-metrics), the Kubernetes Cluster events feature requires the use of the alloy-singleton collector.
alloy-singleton:
  enabled: true
# Alloy DaemonSet for collecting logs from each node
alloy-logs:
  enabled: true
# Alloy deployment for receiving OTLP data from applications
alloy-receiver:
  enabled: true
# Alloy for collecting profiling data via eBPF
alloy-profiles:
  enabled: true
# Common settings for all Alloy collector instances
collectorCommon:
  alloy:
    # Ensure collectors are scheduled even under resource pressure
    priorityClassName: system-node-critical
    controller:
      priorityClassName: system-node-critical
EOF
helm upgrade --install --version "${K8S_MONITORING_HELM_CHART_VERSION}" --namespace k8s-monitoring --create-namespace --values "${TMP_DIR}/${CLUSTER_FQDN}/helm_values-k8s-monitoring.yml" k8s-monitoring grafana/k8s-monitoring
Grafana
Grafana is an open-source analytics and monitoring platform that allows you to query, visualize, alert on, and understand your metrics, logs, and traces. It provides a powerful and flexible way to create dashboards and visualizations for monitoring your Kubernetes cluster and applications.
![]()
Install the grafana Helm chart and modify its default values:
1
2
3
4
5
6
7
8
9
10
11
12
13
14
15
16
17
18
19
20
21
22
23
24
25
26
27
28
29
30
31
32
33
34
35
36
37
38
39
40
41
42
43
44
45
46
47
48
49
50
51
52
53
54
55
56
57
58
59
60
61
62
63
64
65
66
67
68
69
70
71
72
73
74
75
76
77
78
79
80
81
82
83
84
85
86
87
88
89
90
91
92
93
94
95
96
97
98
99
100
101
102
103
104
105
106
107
108
109
110
111
112
113
114
115
116
117
118
119
120
121
122
123
124
125
126
127
128
129
130
131
132
133
134
135
136
137
138
139
140
141
142
143
144
145
146
147
148
149
150
151
152
153
154
155
156
157
158
159
160
161
162
163
164
165
166
167
168
169
170
171
172
173
174
175
176
177
178
179
180
181
182
183
184
185
186
187
188
189
190
191
192
193
194
195
196
197
198
199
200
201
202
203
204
205
206
207
208
209
210
211
212
213
214
215
216
217
218
219
220
221
222
223
224
225
226
227
228
229
230
231
232
233
234
235
236
237
238
239
240
241
242
243
244
245
246
247
248
249
250
251
252
253
254
255
256
257
258
259
260
261
262
263
264
265
266
267
268
269
270
271
272
273
274
275
276
277
278
279
280
281
282
283
284
285
286
287
288
289
290
291
292
293
294
295
296
297
298
299
300
301
302
303
304
305
306
307
308
309
310
311
312
313
314
315
316
317
318
319
320
321
322
323
# renovate: datasource=helm depName=grafana registryUrl=https://grafana.github.io/helm-charts
GRAFANA_HELM_CHART_VERSION="10.5.5"

helm repo add --force-update grafana https://grafana.github.io/helm-charts
tee "${TMP_DIR}/${CLUSTER_FQDN}/helm_values-grafana.yml" << EOF
serviceMonitor:
  enabled: true
ingress:
  enabled: true
  ingressClassName: nginx
  annotations:
    gethomepage.dev/description: Visualization Platform
    gethomepage.dev/enabled: "true"
    gethomepage.dev/group: Observability
    gethomepage.dev/icon: grafana.svg
    gethomepage.dev/name: Grafana
    gethomepage.dev/app: grafana
    gethomepage.dev/pod-selector: "app.kubernetes.io/name=grafana"
    nginx.ingress.kubernetes.io/auth-url: https://oauth2-proxy.${CLUSTER_FQDN}/oauth2/auth
    nginx.ingress.kubernetes.io/auth-signin: https://oauth2-proxy.${CLUSTER_FQDN}/oauth2/start?rd=\$scheme://\$host\$request_uri
    nginx.ingress.kubernetes.io/configuration-snippet: |
      auth_request_set \$email \$upstream_http_x_auth_request_email;
      proxy_set_header X-Email \$email;
  path: /
  pathType: Prefix
  hosts:
    - grafana.${CLUSTER_FQDN}
  tls:
    - hosts:
        - grafana.${CLUSTER_FQDN}
datasources:
  datasources.yaml:
    apiVersion: 1
    datasources:
      - name: Mimir
        type: prometheus
        url: http://mimir-gateway.mimir.svc.cluster.local/prometheus
        isDefault: true
        jsonData:
          prometheusType: Mimir
          prometheusVersion: 2.9.1
          # Scrape interval must match Prometheus/Mimir config for accurate rate() calculations (CPU usage in Node Exporter Full dashboard)
          timeInterval: "1m"
      - name: Loki
        type: loki
        url: http://loki-gateway.loki.svc.cluster.local/
        access: proxy
      - name: Tempo
        type: tempo
        url: http://tempo.tempo.svc.cluster.local:3200
        access: proxy
      - name: Pyroscope
        type: grafana-pyroscope-datasource
        url: http://pyroscope.pyroscope.svc.cluster.local:4040
      - name: Alertmanager
        type: alertmanager
        url: http://mimir-alertmanager.mimir.svc.cluster.local:8080
        access: proxy
        editable: true
        jsonData:
          implementation: mimir
notifiers:
  notifiers.yaml:
    notifiers:
    - name: email-notifier
      type: email
      uid: email1
      org_id: 1
      is_default: true
      settings:
        addresses: ${MY_EMAIL}
dashboardProviders:
  dashboardproviders.yaml:
    apiVersion: 1
    providers:
      - name: "default"
        orgId: 1
        folder: ""
        type: file
        disableDeletion: false
        editable: false
        options:
          path: /var/lib/grafana/dashboards/default
dashboards:
  default:
    # keep-sorted start numeric=yes
    1860-node-exporter-full:
      # renovate: depName="Node Exporter Full"
      gnetId: 1860
      revision: 42
      datasource: Mimir
    9614-nginx-ingress-controller:
      # renovate: depName="NGINX Ingress controller"
      gnetId: 9614
      revision: 1
      datasource: Mimir
    # https://github.com/DevOps-Nirvana/Grafana-Dashboards
    14314-kubernetes-nginx-ingress-controller-nextgen-devops-nirvana:
      # renovate: depName="Kubernetes Nginx Ingress Prometheus NextGen"
      gnetId: 14314
      revision: 2
      datasource: Mimir
    23969-external-dns:
      # renovate: depName="External DNS"
      gnetId: 23969
      revision: 1
      datasource: Mimir
    15757-kubernetes-views-global:
      # renovate: depName="Kubernetes / Views / Global"
      gnetId: 15757
      revision: 43
      datasource: Mimir
    15758-kubernetes-views-namespaces:
      # renovate: depName="Kubernetes / Views / Namespaces"
      gnetId: 15758
      revision: 44
      datasource: Mimir
    15759-kubernetes-views-nodes:
      # renovate: depName="Kubernetes / Views / Nodes"
      gnetId: 15759
      revision: 40
      datasource: Mimir
    # https://grafana.com/orgs/imrtfm/dashboards - https://github.com/dotdc/grafana-dashboards-kubernetes
    15760-kubernetes-views-pods:
      # renovate: depName="Kubernetes / Views / Pods"
      gnetId: 15760
      revision: 37
      datasource: Mimir
    15761-kubernetes-system-api-server:
      # renovate: depName="Kubernetes / System / API Server"
      gnetId: 15761
      revision: 20
      datasource: Mimir
    15762-kubernetes-system-coredns:
      # renovate: depName="Kubernetes / System / CoreDNS"
      gnetId: 15762
      revision: 22
      datasource: Mimir
    16006-mimir-alertmanager-resources:
      # renovate: depName="Mimir / Alertmanager resources"
      gnetId: 16006
      revision: 17
      datasource: Mimir
    16007-mimir-alertmanager:
      # renovate: depName="Mimir / Alertmanager"
      gnetId: 16007
      revision: 17
      datasource: Mimir
    16008-mimir-compactor-resources:
      # renovate: depName="Mimir / Compactor resources"
      gnetId: 16008
      revision: 17
      datasource: Mimir
    16009-mimir-compactor:
      # renovate: depName="Mimir / Compactor"
      gnetId: 16009
      revision: 17
      datasource: Mimir
    16010-mimir-config:
      # renovate: depName="Mimir / Config"
      gnetId: 16010
      revision: 17
      datasource: Mimir
    16011-mimir-object-store:
      # renovate: depName="Mimir / Object Store"
      gnetId: 16011
      revision: 17
      datasource: Mimir
    16012-mimir-overrides:
      # renovate: depName="Mimir / Overrides"
      gnetId: 16012
      revision: 17
      datasource: Mimir
    16013-mimir-queries:
      # renovate: depName="Mimir / Queries"
      gnetId: 16013
      revision: 17
      datasource: Mimir
    16014-mimir-reads-networking:
      # renovate: depName="Mimir / Reads networking"
      gnetId: 16014
      revision: 17
      datasource: Mimir
    16015-mimir-reads-resources:
      # renovate: depName="Mimir / Reads resources"
      gnetId: 16015
      revision: 17
      datasource: Mimir
    16016-mimir-reads:
      # renovate: depName="Mimir / Reads"
      gnetId: 16016
      revision: 17
      datasource: Mimir
    16017-mimir-rollout-progress:
      # renovate: depName="Mimir / Rollout progress"
      gnetId: 16017
      revision: 17
      datasource: Mimir
    16018-mimir-ruler:
      # renovate: depName="Mimir / Ruler"
      gnetId: 16018
      revision: 17
      datasource: Mimir
    16019-mimir-scaling:
      # renovate: depName="Mimir / Scaling"
      gnetId: 16019
      revision: 17
      datasource: Mimir
    16020-mimir-slow-queries:
      # renovate: depName="Mimir / Slow queries"
      gnetId: 16020
      revision: 17
      datasource: Mimir
    16021-mimir-tenants:
      # renovate: depName="Mimir / Tenants"
      gnetId: 16021
      revision: 17
      datasource: Mimir
    16022-mimir-top-tenants:
      # renovate: depName="Mimir / Top tenants"
      gnetId: 16022
      revision: 16
      datasource: Mimir
    16023-mimir-writes-networking:
      # renovate: depName="Mimir / Writes networking"
      gnetId: 16023
      revision: 16
      datasource: Mimir
    16024-mimir-writes-resources:
      # renovate: depName="Mimir / Writes resources"
      gnetId: 16024
      revision: 17
      datasource: Mimir
    16026-mimir-writes:
      # renovate: depName="Mimir / Writes"
      gnetId: 16026
      revision: 17
      datasource: Mimir
    17605-mimir-overview-networking:
      # renovate: depName="Mimir / Overview networking"
      gnetId: 17605
      revision: 13
      datasource: Mimir
    17606-mimir-overview-resources:
      # renovate: depName="Mimir / Overview resources"
      gnetId: 17606
      revision: 13
      datasource: Mimir
    17607-mimir-overview:
      # renovate: depName="Mimir / Overview"
      gnetId: 17607
      revision: 13
      datasource: Mimir
    17608-mimir-remote-ruler-reads:
      # renovate: depName="Mimir / Remote ruler reads"
      gnetId: 17608
      revision: 13
      datasource: Mimir
    17609-mimir-remote-ruler-reads-resources:
      # renovate: depName="Mimir / Remote ruler reads resources"
      gnetId: 17609
      revision: 13
      datasource: Mimir
    19923-beyla-red-metrics:
      # renovate: depName="Beyla RED Metrics"
      gnetId: 19923
      revision: 3
      datasource: Mimir
    20842-cert-manager-kubernetes:
      # renovate: depName="Cert-manager-Kubernetes"
      gnetId: 20842
      revision: 3
      datasource: Mimir
    22184-cert-manager2:
      # renovate: depName="cert-manager2"
      gnetId: 22184
      revision: 3
      datasource: Mimir
    22171-kubernetes-autoscaling-karpenter-overview:
      # renovate: depName="Kubernetes / Autoscaling / Karpenter / Overview"
      gnetId: 22171
      revision: 3
      datasource: Mimir
    22172-kubernetes-autoscaling-karpenter-activity:
      # renovate: depName="Kubernetes / Autoscaling / Karpenter / Activity"
      gnetId: 22172
      revision: 3
      datasource: Mimir
    22173-kubernetes-autoscaling-karpenter-performance:
      # renovate: depName="Kubernetes / Autoscaling / Karpenter / Performance"
      gnetId: 22173
      revision: 3
      datasource: Mimir
    23471-karpenter-cluster-cost-estimate:
      # renovate: depName="Karpenter Cluster Cost Estimate"
      gnetId: 23471
      revision: 1
      datasource: Mimir
    23838-velero-overview:
      # renovate: depName="Velero Overview"
      gnetId: 23838
      revision: 1
      datasource: Mimir
    # keep-sorted end
grafana.ini:
  analytics:
    check_for_updates: false
  auth.basic:
    enabled: false
  auth.proxy:
    enabled: true
    header_name: X-Email
    header_property: email
  smtp:
    enabled: true
    host: mailpit-smtp.mailpit.svc.cluster.local:25
    from_address: grafana@${CLUSTER_FQDN}
  users:
    auto_assign_org_role: Admin
networkPolicy:
  enabled: true
EOF
helm upgrade --install --version "${GRAFANA_HELM_CHART_VERSION}" --namespace grafana --create-namespace --values "${TMP_DIR}/${CLUSTER_FQDN}/helm_values-grafana.yml" grafana grafana/grafana
Mailpit
Mailpit will be used to receive email alerts from Prometheus.

Install the mailpit Helm chart and modify its default values:
1
2
3
4
5
6
7
8
9
10
11
12
13
14
15
16
17
18
19
# renovate: datasource=helm depName=mailpit registryUrl=https://jouve.github.io/charts/
MAILPIT_HELM_CHART_VERSION="0.31.0"

helm repo add --force-update jouve https://jouve.github.io/charts/
tee "${TMP_DIR}/${CLUSTER_FQDN}/helm_values-mailpit.yml" << EOF
ingress:
  enabled: true
  ingressClassName: nginx
  annotations:
    gethomepage.dev/enabled: "true"
    gethomepage.dev/description: An email and SMTP testing tool with API for developers
    gethomepage.dev/group: Apps
    gethomepage.dev/icon: https://raw.githubusercontent.com/axllent/mailpit/61241f11ac94eb33bd84e399129992250eff56ce/server/ui/favicon.svg
    gethomepage.dev/name: Mailpit
    nginx.ingress.kubernetes.io/auth-url: https://oauth2-proxy.${CLUSTER_FQDN}/oauth2/auth
    nginx.ingress.kubernetes.io/auth-signin: https://oauth2-proxy.${CLUSTER_FQDN}/oauth2/start?rd=\$scheme://\$host\$request_uri
  hostname: mailpit.${CLUSTER_FQDN}
EOF
helm upgrade --install --version "${MAILPIT_HELM_CHART_VERSION}" --namespace mailpit --create-namespace --values "${TMP_DIR}/${CLUSTER_FQDN}/helm_values-mailpit.yml" mailpit jouve/mailpit
Screenshot:
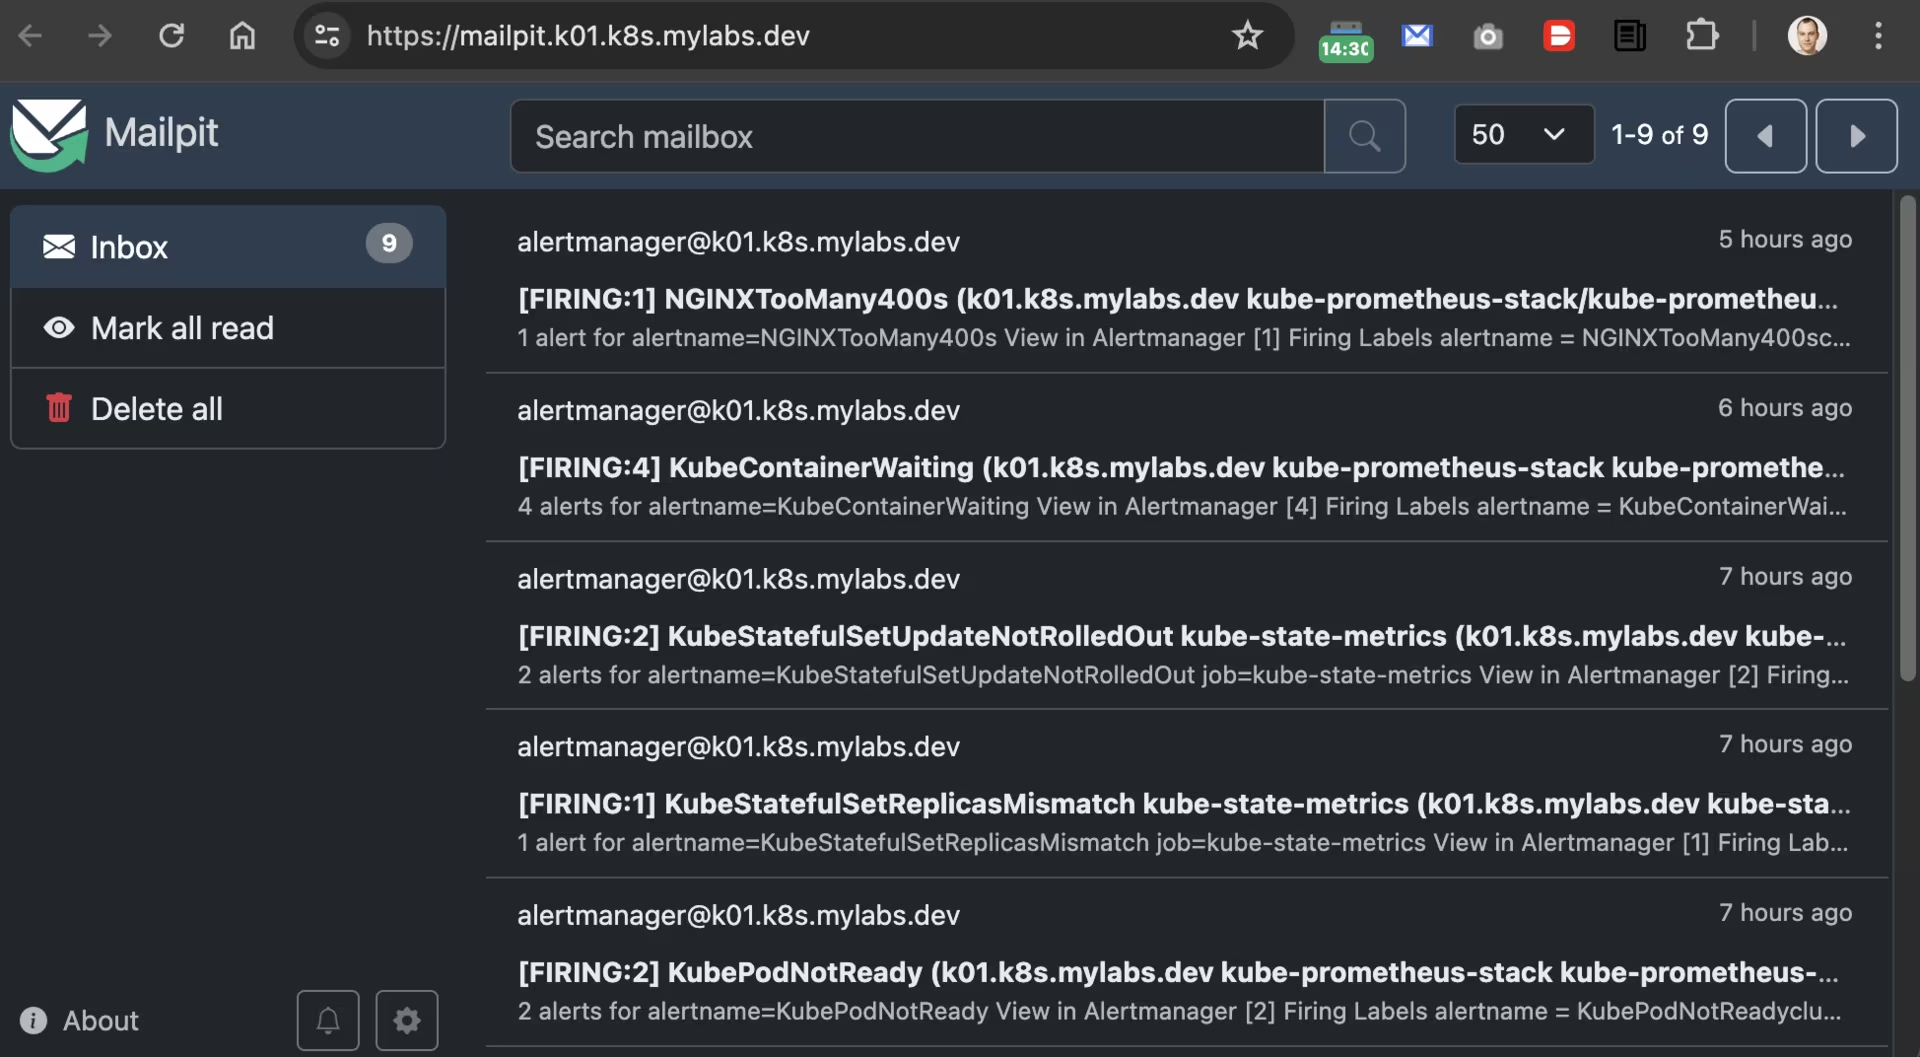
OAuth2 Proxy
Use OAuth2 Proxy to protect application endpoints with Google Authentication.

Install the oauth2-proxy Helm chart and modify its default values:
1
2
3
4
5
6
7
8
9
10
11
12
13
14
15
16
17
18
19
20
21
22
23
24
25
26
27
28
29
30
31
32
33
34
35
36
37
38
39
40
41
42
43
44
45
46
47
48
49
50
51
52
53
# renovate: datasource=helm depName=oauth2-proxy registryUrl=https://oauth2-proxy.github.io/manifests
OAUTH2_PROXY_HELM_CHART_VERSION="10.0.0"

set +x
COOKIE_SECRET="$(openssl rand -base64 32 | head -c 32 | base64)"
echo "::add-mask::${COOKIE_SECRET}"
set -x

helm repo add --force-update oauth2-proxy https://oauth2-proxy.github.io/manifests
tee "${TMP_DIR}/${CLUSTER_FQDN}/helm_values-oauth2-proxy.yml" << EOF
config:
  clientID: ${GOOGLE_CLIENT_ID}
  clientSecret: ${GOOGLE_CLIENT_SECRET}
  cookieSecret: ${COOKIE_SECRET}
  configFile: |-
    cookie_domains = ".${CLUSTER_FQDN}"
    set_authorization_header = "true"
    set_xauthrequest = "true"
    upstreams = [ "file:///dev/null" ]
    whitelist_domains = ".${CLUSTER_FQDN}"
authenticatedEmailsFile:
  enabled: true
  restricted_access: |-
    ${MY_EMAIL}
ingress:
  enabled: true
  ingressClassName: nginx
  annotations:
    gethomepage.dev/enabled: "true"
    gethomepage.dev/description: A reverse proxy that provides authentication with Google, Azure, OpenID Connect and many more identity providers
    gethomepage.dev/group: Cluster Management
    gethomepage.dev/icon: https://raw.githubusercontent.com/oauth2-proxy/oauth2-proxy/899c743afc71e695964165deb11f50b9a0703c97/docs/static/img/logos/OAuth2_Proxy_icon.svg
    gethomepage.dev/name: OAuth2-Proxy
  hosts:
    - oauth2-proxy.${CLUSTER_FQDN}
  tls:
    - hosts:
        - oauth2-proxy.${CLUSTER_FQDN}
priorityClassName: critical-priority
affinity:
  podAntiAffinity:
    requiredDuringSchedulingIgnoredDuringExecution:
    - labelSelector:
        matchLabels:
          app.kubernetes.io/component: authentication-proxy
          app.kubernetes.io/instance: oauth2-proxy
      topologyKey: kubernetes.io/hostname
replicaCount: 2
metrics:
  servicemonitor:
    enabled: true
EOF
helm upgrade --install --version "${OAUTH2_PROXY_HELM_CHART_VERSION}" --namespace oauth2-proxy --create-namespace --values "${TMP_DIR}/${CLUSTER_FQDN}/helm_values-oauth2-proxy.yml" oauth2-proxy oauth2-proxy/oauth2-proxy
Homepage
Install Homepage to provide a nice dashboard.

Install the homepage Helm chart and modify its default values:
1
2
3
4
5
6
7
8
9
10
11
12
13
14
15
16
17
18
19
20
21
22
23
24
25
26
27
28
29
30
31
32
33
34
35
36
37
38
39
40
41
42
43
44
45
46
47
48
49
50
51
52
53
54
55
56
57
58
59
60
61
62
63
64
65
66
# renovate: datasource=helm depName=homepage registryUrl=http://jameswynn.github.io/helm-charts
HOMEPAGE_HELM_CHART_VERSION="2.1.0"

helm repo add --force-update jameswynn http://jameswynn.github.io/helm-charts
cat > "${TMP_DIR}/${CLUSTER_FQDN}/helm_values-homepage.yml" << EOF
enableRbac: true
serviceAccount:
  create: true
ingress:
  main:
    enabled: true
    annotations:
      gethomepage.dev/enabled: "true"
      gethomepage.dev/name: Homepage
      gethomepage.dev/description: A modern, secure, highly customizable application dashboard
      gethomepage.dev/group: Apps
      gethomepage.dev/icon: homepage.png
      nginx.ingress.kubernetes.io/auth-url: https://oauth2-proxy.${CLUSTER_FQDN}/oauth2/auth
      nginx.ingress.kubernetes.io/auth-signin: https://oauth2-proxy.${CLUSTER_FQDN}/oauth2/start?rd=\$scheme://\$host\$request_uri
    ingressClassName: nginx
    hosts:
      - host: ${CLUSTER_FQDN}
        paths:
          - path: /
            pathType: Prefix
    tls:
      - hosts:
          - ${CLUSTER_FQDN}
config:
  bookmarks:
  services:
  widgets:
    - logo:
        icon: kubernetes.svg
    - kubernetes:
        cluster:
          show: true
          cpu: true
          memory: true
          showLabel: true
          label: "${CLUSTER_NAME}"
        nodes:
          show: true
          cpu: true
          memory: true
          showLabel: true
  kubernetes:
    mode: cluster
  settings:
    hideVersion: true
    title: ${CLUSTER_FQDN}
    favicon: https://raw.githubusercontent.com/homarr-labs/dashboard-icons/38631ad11695467d7a9e432d5fdec7a39a31e75f/svg/kubernetes.svg
    layout:
      Apps:
        icon: mdi-apps
      Observability:
        icon: mdi-chart-bell-curve-cumulative
      Cluster Management:
        icon: mdi-tools
env:
  - name: HOMEPAGE_ALLOWED_HOSTS
    value: ${CLUSTER_FQDN}
  - name: LOG_TARGETS
    value: stdout
EOF
helm upgrade --install --version "${HOMEPAGE_HELM_CHART_VERSION}" --namespace homepage --create-namespace --values "${TMP_DIR}/${CLUSTER_FQDN}/helm_values-homepage.yml" homepage jameswynn/homepage
Clean-up
![]()
Back up the certificate before deleting the cluster (in case it was renewed):
1
2
3
if [[ "$(kubectl get --raw /api/v1/namespaces/cert-manager/services/cert-manager:9402/proxy/metrics | awk '/certmanager_http_acme_client_request_count.*acme-v02\.api.*finalize/ { print $2 }')" -gt 0 ]]; then
  velero backup create --labels letsencrypt=production --ttl 2160h --from-schedule velero-monthly-backup-cert-manager-production
fi
Stop Karpenter from launching additional nodes:
1
2
helm uninstall -n karpenter karpenter || true
helm uninstall -n ingress-nginx ingress-nginx || true
Remove any remaining EC2 instances provisioned by Karpenter (if they still exist):
1
2
3
4
for EC2 in $(aws ec2 describe-instances --filters "Name=tag:kubernetes.io/cluster/${CLUSTER_NAME},Values=owned" "Name=tag:karpenter.sh/nodepool,Values=*" Name=instance-state-name,Values=running --query "Reservations[].Instances[].InstanceId" --output text); do
  echo "🗑️  Removing Karpenter EC2: ${EC2}"
  aws ec2 terminate-instances --instance-ids "${EC2}"
done
Disassociate a Route 53 Resolver query log configuration from an Amazon VPC:
1
2
3
4
5
6
7
for RESOLVER_QUERY_LOG_CONFIGS_ID in $(aws route53resolver list-resolver-query-log-configs --query "ResolverQueryLogConfigs[?contains(DestinationArn, '/aws/eks/${CLUSTER_NAME}/cluster')].Id" --output text); do
  RESOLVER_QUERY_LOG_CONFIG_ASSOCIATIONS_RESOURCEID=$(aws route53resolver list-resolver-query-log-config-associations --filters "Name=ResolverQueryLogConfigId,Values=${RESOLVER_QUERY_LOG_CONFIGS_ID}" --query 'ResolverQueryLogConfigAssociations[].ResourceId' --output text)
  if [[ -n "${RESOLVER_QUERY_LOG_CONFIG_ASSOCIATIONS_RESOURCEID}" ]]; then
    aws route53resolver disassociate-resolver-query-log-config --resolver-query-log-config-id "${RESOLVER_QUERY_LOG_CONFIGS_ID}" --resource-id "${RESOLVER_QUERY_LOG_CONFIG_ASSOCIATIONS_RESOURCEID}"
    sleep 5
  fi
done
Clean up AWS Route 53 Resolver query log configurations:
1
2
3
for AWS_CLUSTER_ROUTE53_RESOLVER_QUERY_LOG_CONFIG_ID in $(aws route53resolver list-resolver-query-log-configs --query "ResolverQueryLogConfigs[?Name=='${CLUSTER_NAME}-vpc-dns-logs'].Id" --output text); do
  aws route53resolver delete-resolver-query-log-config --resolver-query-log-config-id "${AWS_CLUSTER_ROUTE53_RESOLVER_QUERY_LOG_CONFIG_ID}"
done
Remove the EKS cluster and its created components:
1
2
3
if eksctl get cluster --name="${CLUSTER_NAME}"; then
  eksctl delete cluster --name="${CLUSTER_NAME}" --force
fi
Remove the Route 53 DNS records from the DNS Zone:
1
2
3
4
5
6
7
8
9
10
CLUSTER_FQDN_ZONE_ID=$(aws route53 list-hosted-zones --query "HostedZones[?Name==\`${CLUSTER_FQDN}.\`].Id" --output text)
if [[ -n "${CLUSTER_FQDN_ZONE_ID}" ]]; then
  aws route53 list-resource-record-sets --hosted-zone-id "${CLUSTER_FQDN_ZONE_ID}" | jq -c '.ResourceRecordSets[] | select (.Type != "SOA" and .Type != "NS")' |
    while read -r RESOURCERECORDSET; do
      aws route53 change-resource-record-sets \
        --hosted-zone-id "${CLUSTER_FQDN_ZONE_ID}" \
        --change-batch '{"Changes":[{"Action":"DELETE","ResourceRecordSet": '"${RESOURCERECORDSET}"' }]}' \
        --output text --query 'ChangeInfo.Id'
    done
fi
Delete Instance profile which belongs to Karpenter role:
1
2
3
4
5
6
if AWS_INSTANCE_PROFILES_FOR_ROLE=$(aws iam list-instance-profiles-for-role --role-name "KarpenterNodeRole-${CLUSTER_NAME}" --query 'InstanceProfiles[].{Name:InstanceProfileName}' --output text); then
  if [[ -n "${AWS_INSTANCE_PROFILES_FOR_ROLE}" ]]; then
    aws iam remove-role-from-instance-profile --instance-profile-name "${AWS_INSTANCE_PROFILES_FOR_ROLE}" --role-name "KarpenterNodeRole-${CLUSTER_NAME}"
    aws iam delete-instance-profile --instance-profile-name "${AWS_INSTANCE_PROFILES_FOR_ROLE}"
  fi
fi
Remove the CloudFormation stack:
1
2
3
4
5
aws cloudformation delete-stack --stack-name "${CLUSTER_NAME}-route53-kms"
aws cloudformation delete-stack --stack-name "${CLUSTER_NAME}-karpenter"
aws cloudformation wait stack-delete-complete --stack-name "${CLUSTER_NAME}-route53-kms"
aws cloudformation wait stack-delete-complete --stack-name "${CLUSTER_NAME}-karpenter"
aws cloudformation wait stack-delete-complete --stack-name "eksctl-${CLUSTER_NAME}-cluster"
Remove volumes and snapshots related to the cluster (as a precaution):
1
2
3
4
5
6
7
8
9
10
for VOLUME in $(aws ec2 describe-volumes --filter "Name=tag:KubernetesCluster,Values=${CLUSTER_NAME}" "Name=tag:kubernetes.io/cluster/${CLUSTER_NAME},Values=owned" --query 'Volumes[].VolumeId' --output text); do
  echo "Removing Volume: ${VOLUME}"
  aws ec2 delete-volume --volume-id "${VOLUME}"
done

# Remove EBS snapshots associated with the cluster
for SNAPSHOT in $(aws ec2 describe-snapshots --owner-ids self --filter "Name=tag:Name,Values=${CLUSTER_NAME}-dynamic-snapshot*" "Name=tag:kubernetes.io/cluster/${CLUSTER_NAME},Values=owned" --query 'Snapshots[].SnapshotId' --output text); do
  echo "Removing Snapshot: ${SNAPSHOT}"
  aws ec2 delete-snapshot --snapshot-id "${SNAPSHOT}"
done
Remove the CloudWatch log group:
1
2
3
if [[ "$(aws logs describe-log-groups --query "logGroups[?logGroupName==\`/aws/eks/${CLUSTER_NAME}/cluster\`] | [0].logGroupName" --output text)" = "/aws/eks/${CLUSTER_NAME}/cluster" ]]; then
  aws logs delete-log-group --log-group-name "/aws/eks/${CLUSTER_NAME}/cluster"
fi
Remove the ${TMP_DIR}/${CLUSTER_FQDN} directory:
1
2
3
4
5
6
7
8
9
10
if [[ -d "${TMP_DIR}/${CLUSTER_FQDN}" ]]; then
  for FILE in "${TMP_DIR}/${CLUSTER_FQDN}"/{kubeconfig-${CLUSTER_NAME}.conf,{aws-cf-route53-kms,cloudformation-karpenter,eksctl-${CLUSTER_NAME},helm_values-{aws-load-balancer-controller,cert-manager,external-dns,grafana,homepage,ingress-nginx,k8s-monitoring,karpenter,loki,mailpit,mimir-distributed,oauth2-proxy,pyroscope,tempo,velero},k8s-{karpenter-nodepool,scheduling-priorityclass,storage-snapshot-storageclass-volumesnapshotclass}}.yml}; do
    if [[ -f "${FILE}" ]]; then
      rm -v "${FILE}"
    else
      echo "❌ File not found: ${FILE}"
    fi
  done
  rmdir "${TMP_DIR}/${CLUSTER_FQDN}"
fi
Enjoy … 😉